|
SOCR Analyses – an Instructional Java Web-based Statistical Analysis Toolkit
Annie Chu, Jenny Cui, and Ivo D. Dinov
The SOCR Resource
UCLA Department of Statistics
Los Angeles, CA 90095
dinov@stat.ucla.edu
Abstract
The Statistical Online Computational Resource (SOCR) designs web-based tools for educational use in a variety of undergraduate courses (Dinov 2006). Several studies have demonstrated that these resources significantly improve students' motivation and learning experiences (Dinov et al. 2008). SOCR Analyses is a new component that concentrates on data modeling and analysis using parametric and non-parametric techniques supported with graphical model diagnostics. Currently implemented analyses include commonly used models in undergraduate statistics courses like linear models (Simple Linear Regression, Multiple Linear Regression, One-Way and Two-Way ANOVA). In addition, we implemented tests for sample comparisons, such as t-test in the parametric category; and Wilcoxon rank sum test, Kruskal-Wallis test, Friedman's test, in the non-parametric category. SOCR Analyses also include several hypothesis test models, such as Contingency tables, Friedman's test and Fisher's exact test.
The code itself is open source (http://socr.googlecode.com/), hoping to contribute to the efforts of the statistical computing community. The code includes functionality for each specific analysis model and it has general utilities that can be applied in various statistical computing tasks. For example, concrete methods with API (Application Programming Interface) have been implemented in statistical summary, least square solutions of general linear models, rank calculations, etc. HTML interfaces, tutorials, source code, activities, and data are freely available via the web (www.SOCR.ucla.edu). Code examples for developers and demos for educators are provided on the SOCR Wiki website.
In this article, the pedagogical utilization of the SOCR Analyses is discussed, as well as the underlying design framework. As the SOCR project is on-going and more functions and tools are being added to it, these resources are constantly improved. The reader is strongly encouraged to check the SOCR site for most updated information and newly added models.
Keywords : distributed learning environment, SOCR, statistical analyses, statistics education, online resources.
|
Introduction
The Statistics Online Computational Resource (www.SOCR.ucla.edu) was funded by the NSF to develop, validate and widely disseminate integrated tools for probability and statistics education. The purpose of the SOCR project is to provide a free, web-based and browser-independent suite of tools; to have a well-designed, extensible and open-sources library; to introduce a graphical user interface (GUI) to statistical resources; and to present an integrated framework for course-material, simulation and computation web-resources. An experimental study conducted with UCLA undergraduates as subjects, has show significantly higher performance of the SOCR treatment group versus the control group using traditional teaching methods. Another benefit is that student performance in the treatment group is more homogeneous. The treatment group reported more satisfaction and found the course more interesting to take than the control group (Dinov et al. 2008).
The first SOCR components included Experiments, Distributions and Games (Dinov 2006). Two new components, SOCR Analyses and Modelers, are newly developed. In this article, we will discuss the pedagogical utilization of SOCR Analyses. The authors were motivated to develop SOCR Analyses to provide a free web-based graphical resource for data mining (using either parametric or non-parametric models), residual diagnostics, and computation of power and sample size. One of the goals is to make available a collection of all the commonly used statistics analyses accessible in one package and provide seamless data transfer between SOCR Analyses and all other tools. Currently, for such types of analyses, students and scholars have to mostly rely on software that either requires a license or a steep learning curve, even for users with some statistical background. There are also some web-based tools available that do not provide code base or examples, which limit the options for code modification and broad use for variety of projects. Many other web-based tools scattered in the cyber-space are applicable for merely a single analysis, not integrated as collections and demand more of the user's time and effort on tool searching and interoperability.
According to some popular websites that compile statistics tools and provide evaluations (Pezzullo 2007; Shackman 2008; CAUSEWEB), many free tools tend to have one or more of the disadvantages described below: (1) some tools have only limited functionalities as free versions; (2) some have to be downloaded to local computers, which is not always feasible for students who do not own a computer or are required to complete their work in school laboratories; (3) some free tools are based on JavaScript, which has behaviors that may be browser dependent; (4) many of the Java based online tools have either single or very few analyses to meet a small portion of course curriculum, and this yields the instructors' burden to search for proper tools; (5) many of the tools concentrate on specific subject matters (e.g. public health, engineering, business) that may not be suitable for college level introductory course or even high school lessens in general; (6) some have steeper learning curve that may not be adopted by students unfamiliar with code writing; (7) some are lacking detailed tutorial pages or examples; (8) lastly, from the programming aspect, some tools are well implemented but only used for very few analyses without objects being reused, and this may be somewhat a waste of programming labor.
The second section provides a gallery of SOCR Analysis examples. A complete list of examples, activities and tutorials for each type of SOCR Analysis are available online. In this manuscript we show five instances of examples, which give instructional guidance and serve as tutorials for students and educators. The third section presents a brief introduction to the SOCR Analyses' design framework and provides documentation of interest to potential programmers. A discussion of the computational implementation appears in the next section. This will facilitate the utilization of the binary code and help with extending the SOCR Analyses source code. Conclusion and discussion of future work is given in the last section.
The Interactive SOCR Hyperbolic-Wheel Navigator is a newly developed interface, which provides a graphical overview of the entire SOCR infrastructure. It can be used for exploration of relationship among all SOCR computational tools (e.g., Java applets), learning materials (e.g., activities) and instructional resources (e.g., EBook). The user may browse all SOCR materials in a hierarchical tree map including the SOCR Analyses, the documentation of various analyses, activities, hands-on demonstrations and the statistics EBook. Starting from a macro viewpoint, the user can click on a tree node to go into a web page containing the details of the selected node. The Interactive SOCR Hyperbolic-Wheel Navigator may be accessed at: http://socr.ucla.edu/SOCR_HW_Viewer.html.
The SOCR Analyses Applet
This section demonstrates several SOCR Analyses examples. The statistical theory is presented at the beginning of each section. Step-by-step tutorial on usage of the SOCR Analyses models is also given. Due to limitation of space, we only provide 5 examples, however many more are available online.
Simple linear regression (SLR)
The SLR model is the most commonly taught model in undergraduate classes. In our design, SLR is fitted using the simplest way of computation. For multiple linear regression and ANOVA models, we use normal equation and matrix operation. But this is not necessary for SLR, and therefore we use the following scheme to reduce computation overhead.
Suppose the sample size is n, and let x i and y i be the regressor and response, respectively, and ei be the error, following the standard normal assumption. Then the SLR model:

is fitted by the
model
 . .
The least squares solution is

where  and and  represent the sample means of the data, predictor and response, respectively; represent the sample means of the data, predictor and response, respectively;  and and  represent the sample variance of the regressor, and sample covariance, respectively (Jennrich 1995). represent the sample variance of the regressor, and sample covariance, respectively (Jennrich 1995).
Here is an example demonstrating the SOCR SLR analysis. The data used for the demonstration is from (Jennrich 1995, Chapter 1, page 5). The SOCR Analyses applet may be accessed online at http://socr.ucla.edu/htmls/SOCR_Analyses.html. The pull-down combo box, Figure 1A, allows for selecting the desired analysis model. Note that there are buttons at the left panel to provide online help, file loading and screenshot facility, similar to other SOCR components Figure 1B.
- About : Directs to http://mathworld.wolfram.com help site for explanation on this specific analysis model.
- Help : Redirects to http://wiki.stat.ucla.edu/socr/index.php/Help_pages_for_SOCR_Analyses for general statistical information.
- Snapshot : Enables snapshot functionality similar to print screen.
- Copy/Paste : To assist with data copying or pasting. Note that the key sequence Apple-C and Applet-V (Apple/Macintosh) and Ctrl-C and Ctrl-V (Windows) may not work in the applet, depending on the browser settings.
- File Open : For loading/importing data from the local computer.
Figure 1. SOCR Analysis user interface for simple linear regression. The left (Figure 1A) and
right (Figure 1B) panels show the analysis selection combo box and the main simple linear
regression applet interface, respectively.
Figure 1A: SOCR Analysis Combo box selection
|
Figure 1B: SOCR Analysis view of control buttons and panel tabs
|
|
 |
Figure 1. SOCR Analysis user interface for simple linear regression. The left (Figure 1A) and right (Figure 1B)
panels show the analysis selection combo box and the main simple linear regression applet interface, respectively.
The right panel of the Analysis applet is where we do most of the operations. Taking the Simple Linear Regression as an example, we go through the operations step-by-step.
-
Clicking of the Example button calls for a built-in example.
-
Clicking of the Data tab displays the data spreadsheet, Figure 2A.
-
Before the data are analyzed, the user must click on the Mapping tab. The mapping panel is for selection and assignment of variables (Figure 2B).
-
Clicking of the Calculate button completes the calculation. The user can then click on the Result tab to inspect the results (Figure 2C).
-
The Graph tab displays plots tailored for this particular analysis. The simple linear regression currently has the following charts available: scatter plots of the data, residual on fit, residual on covariate, and normal quantile-quantile plot (Figures 2D, 2E, 2F).
Figure 2A. Simple Linear Regression
Data panel |
Figure 2B. Simple Linear Regression
Mapping panel |
 |
 |
Figure 2C. Simple Linear Regression
Results panel |
Figure 2D. Scatter plot of
Response vs. Regressor |
 |
|
Figure 2E. Residual on fit plot
|
Figure 2F. QQ Normal plot
|
 |
 |
Figure 2. Example of simple linear regression.
Notes:
-
If the user would like to clear the display in each panel of Data, Mapping, Graph and Result, the button Clear may be used. A SOCR programmer should notice that this clears all the memory of the previous example.
-
The button Random Example provides the function of generating random data.
-
The tabs Select Parameter and Compare Curves are not applicable for simple linear regression and some other analyses. We will discuss the usages of these two tabs in the Normal Distribution Power Analysis section below.
One-Way Analysis of Variance (ANOVA)
Figure 3A: 1-Way ANOVA Data panel
|
Figure 3B: 1-Way ANOVA Result Panel
|
 |
 |
Figure 3C: 1-Way ANOVA Residual Fit plot
|
Figure 3D: Residual QQ Normal plot
|
 |
 |
Figure 3. SOCR 1-Way ANOVA example.
ANOVA is a simple model of generalized least square (LS) regression. In the SOCR implementation, matrix operation is used to obtain LS estimates. After checking singularity by computing the correlation coefficient for each pair of user-submitted variables, we use matrix operations (Jennrich 1995):
 . .
For this model, let X be the data matrix where variables represented by the columns and observations being the rows; and X' is its transpose. That is, X=[x i,j] , where x i,j indicates the j thobservation of the i th group and y is the response data. Specifically, for the ANOVA implementation, we need dummy variables. The regression model has the form of:
 , ,
where e i,j indicates the error terms, following the standard normal assumption. The dummy variables are:
 , ,
where  , the Kroneker delta, is 1 when i = k and 0 otherwise. The number of necessary dummy variables is denoted by r, (Jennrich 1995; www.R-Project.org). , the Kroneker delta, is 1 when i = k and 0 otherwise. The number of necessary dummy variables is denoted by r, (Jennrich 1995; www.R-Project.org).
The basic operations of the SOCR Analyses graphical user interface were explained in the Simple linear regression section above. ANOVA is also taught commonly in undergraduate statistics classes. The operations are very similar to the simple linear regression example. However, in the Mapping panel, what gets mapped to the INDEPENDENT variable list must be a factor or categorical variable.
The example data we use for the ANOVA demonstration is from (Jennrich 1995, Chapter 7, page 199). Figure 3 shows some of the analysis results and residual diagnostic plots. The operations and result reading are similar to these in the simple linear regression.
A Non-Parametric Test Example: The Kruskal-Wallis Test
The Kruskal-Wallis test is a commonly used non-parametric test. It is a generalization of the well-known Wilcoxon signed test, which is also included in the SOCR analyses. We will only discuss the Kruskal-Wallis example in this paper, Figure 4.
The statistical theory, methods of computation and the example data are employed from (Conover 1980, Chapter 5, page 231-237). Suppose we have k groups of random samples, possibly of different sizes, and we can list the data points as in Table 1.
Table 1. Symbolic representations of multi-sample data.
Generic Sample Representation
|
Sample 1
|
Sample 2
|
…
|
Sample k |
X 1,1 |
X 2,1 |
… |
X k,1 |
X 1,2 |
X 2,2 |
… |
X k,2 |
… |
… |
… |
… |
X 1,n1 |
X 2,n2 |
… |
X k,nk |
Let N be the total number of observations, then
 . .
Let also R(X i,j) denote the rank assigned to X i,j
and let Ri be the sum of ranks assigned to the ith sample.

The program computes R i for each sample. The test statistic is defined for the following formulation of hypotheses:
- H o : All of the k population distribution functions are identical.
- H 1 : At least one of the populations tends to yield larger observations than at least one of the other populations.
The Kruskal-Wallis test statistics is defined by:
 , ,
where
 . .
If there are no ties, then the test statistic is reduced to:
 . .
However, in the SOCR code, we allow the possibility of having ties; so we use the non-simplified, exact method of computation.
In general, multiple comparisons have to be done in this case. For each pair of groups, the following is computed and printed at the Result panel, Figure 4.

Figure 4A. Kruskal-Wallis Data panel
|
Figure 4B. Kruskal-Wallis Mapping Panel
|
 |
 |
Figure 4C. Kruskal-Wallis Results panel with 3 selected groups
|
Figure 4D. Kruskal-Wallis Results panel with 4 selected groups (partial output)
|
 |
 |
Figure 4 . SOCR Kruskal-Wallis Analysis example.
.Both the end-user and the programmer should note that the SOCR computation employs the exact method instead of the approximate one (Conover 1980), since computation is easy and fast to implement and the exact method is somewhat more accurate.
Survival Analysis Example
In the SOCR survival analysis, we used the well-known Kaplan Meyer method. The computation formulas and example are adopted from one of the methods mentioned in Venables and Ripley (Venables 2002). Let T denote a lifetime random variable taking on values in (0, ∞), the general form of survival function is:
 . .
If the hazard function is denoted by h(t), the cumulative hazard function is H(t), and
 : :

and
 . .
Estimated cumulative hazard function at t i:
 . .
In order to estimate the survival curve, we estimate the cumulative hazard function, and its standard error, for 95% confidence interval (CI). Let i denote the index of the time interval, and I i = [t i , t i+1) covering [0, ∞) be the time, d i the number of “dead” in I i. Then the probability p i of surviving interval I i may be estimated as
 . .
Then the estimate of the cumulative hazard function is:
 , ,
where the sum is over all times at which deaths occurs before t.
The variance of the cumulative hazard function is estimated by:
 . .
The linear scale and the log-survivor ( cumulative hazard) scale CI’s at significance level 1-/2 are given by:
 and and
 . .
A life table is constructed using the estimation of the cumulative hazard function and its standard error
 . .
The SOCR survival analysis example is adopted from (Venables 2002, Chapter 13, page 357), Figure 5A. The Mapping panel for the survival analysis is somewhat different from the previously mentioned examples (Figure 5B). It has three lists that need to be filled out by selecting appropriate variables: time, censored, and group names. The results are displayed in the Result panel, Figure 5C. Note the convention we use for censored (1) vs. not censored (0). The censored data are displayed with a + sign next to them.
Figure 5A. Survival Analysis Data panel
|
Figure 5B. Survival Analysis Mapping Panel
|
 |
 |
Figure 5C. Survival Analysis Results panel
(partial output) |
Figure 5D. Survival plot with confidence limits
|
 |
 |
Figure 5. SOCR Survival Analysis example.
The 95% confidence intervals are also included in the results. In the Graph panel, the modeled rates are marked with darker colors, red and blue, while the 95% CI boundaries are marked with lighter colors, pink and cyan, Figure 5D.
Normal Distribution Power Analysis
The operation of the power analysis stands out from the other analyses. The model currently available in SOCR Analyses is the normal distribution model. There are two basic types of power analysis operations: (1) Obtaining the power for a given sample size; (2) Obtaining the sample size for a given power. Let α and β denote the type I and type II errors, respectively. And let m , m o and m a denote the true mean, the mean under the null and alternative hypotheses, respectively, and s and n represent the input standard deviation and sample size. Table 2 summarizes the hypotheses and formulas we employ (Rice 1995).
Table 2. Power of Normal models.
Hypotheses |
Power |
H o: m = m o
H a: m a > m o
|
 |
H o: m = m o
H a: m a < m o |
 |
H o: m = m o
H a: m a ≠ m o |
 |
To work with these functions, the Select Parameters tab needs to be clicked, Figure 6. In operation (1), the SOCR applet waits for input of hypothesis type, true means of the null (denoted by mu_0 in the applet) and the alternative hypotheses (denoted by mu_A in the applet), standard deviation of the presumed population, and the desired significance level, Figure 6A. The output, corresponding power, can be viewed from the Result panel. In operation (2), all the inputs are the same except the sample size, which now plays the role of the output and the power the role of the input, Figure 6B.
In the Compare Curves panel, we demonstrate comparisons of curves of the distributions of the presumed population and the sample mean. Both the null and the alternative's means are used as parameters to construct the distributions separately. Holding the mouse button can shift the alternative's curves horizontally. This enables shifting the power dynamically, Figure 6C.
The Graph panel shows curves of power vs. sample size. In operation (2), the minimal necessary sample size is provided and a comparison of curves, based on different sample sizes, are plotted into the graph, with an increment of 10(Figure 6D). In this example, significance level = 0.05, SD = 250, mu_0 = 500, mu_A = 600. The minimal sample size required is calculated to be 68; additionally, curves of sample sizes being 78, 88, 98 and 108 are also shown and marked with different colors for easy identification.
Design Framework of SOCR Analyses
The platform independent language Java (http://Java.sun.com) is employed in the development of all SOCR tools, interfaces and libraries. The advantage of using Java web-applets is to enable the user to access these resources either as computational libraries (JAR files) or applet GUIs from anywhere on the Internet, without having to install any software, register or login. This makes all SOCR components browser, hardware and software independent, which lowers the usage barriers for instructors, students and informal learners. These audiences frequently come from various academic backgrounds and may be prohibited, or not know how, to install any programs on their computers.
Figure 6A. Select Parameters panel showing settings to compute the
power |
Figure 6B. Select Parameters panel showing settings to compute the
sample size |
 |
 |
|
Figure 6C. Compare Curves panel
|
Figure 6D. Graph panel – different sample sizes
|
|
 |
 |
|
Figure 6. SOCR Normal Power Analysis example.
All SOCR applets provide help, about and activity support pages. Self-learners or instructor-guided users may quickly get help by following the corresponding tutorials ( http://wiki.stat.ucla.edu/socr/index.php/SOCR_EduMaterials_AnalysesActivities). This improves satisfaction, facilitates quick engagement, and significantly reduces learning barriers. As most modern computers and browsers come with preinstalled rudimentary Java interpreters, SOCR usage does not require any external software download or installation. Furthermore, all SOCR usage is anonymous; there is no need for registration or authentication. Only a browser that supports Java Applets suffices. This easy interface facilitates quick and reproducible teaching and learning. SOCR Analyses may be used online via the SOCR web-server, or downloaded and executed as local applications on the user’s client machine.
The Java programming has been known for its portability. We apply OOP (Object-Oriented Programming) to the development of SOCR Analyses. The purpose of OOP is to achieve high cohesion and low coupling, for the ease of code development and maintenance. Java, being a compiled language, runs fast with the capability of going close to native speed, albeit not as fast as C/C++. The SOCR Analyses component code follows the basic OOP principle of model-view-controller (MVC). The model part does the statistical analyses computation; the view part is the applet GUI; and the controller part goes in between them, dispatching the request from the view to the model and receiving analysis results. The class edu.ucla.stat.SOCR.analyses.data.Data is an object handling the data-carrying mechanism. It utilizes Java collections, HashMap and TreeMap, as its major aggregates. In the direction from the view to model, the Data object is used. Validation is implemented for different data types and for different models, for example, a quantitative type has to be used for a simple regression analysis and a factor type has to be used for an ANOVA's regressor. The controller part fetches data from the applet and constructs a Data object to pass forward to the model part; it also receives the Result object from the model and prints output in the applet display.
As for the direction from the model back to view, the class edu.ucla.stat.SOCR.analyses.result.Result is used to carry the analysis result. Figure 7 depicts the design framework and relationships of MVC. As an alternative, a programmer can implement the application of the view part instead of using the applet by either getting the SOCR Analyses binary libraries or source code.
Figure 7. SOCR Analysis model-view-controller (MVC) design.
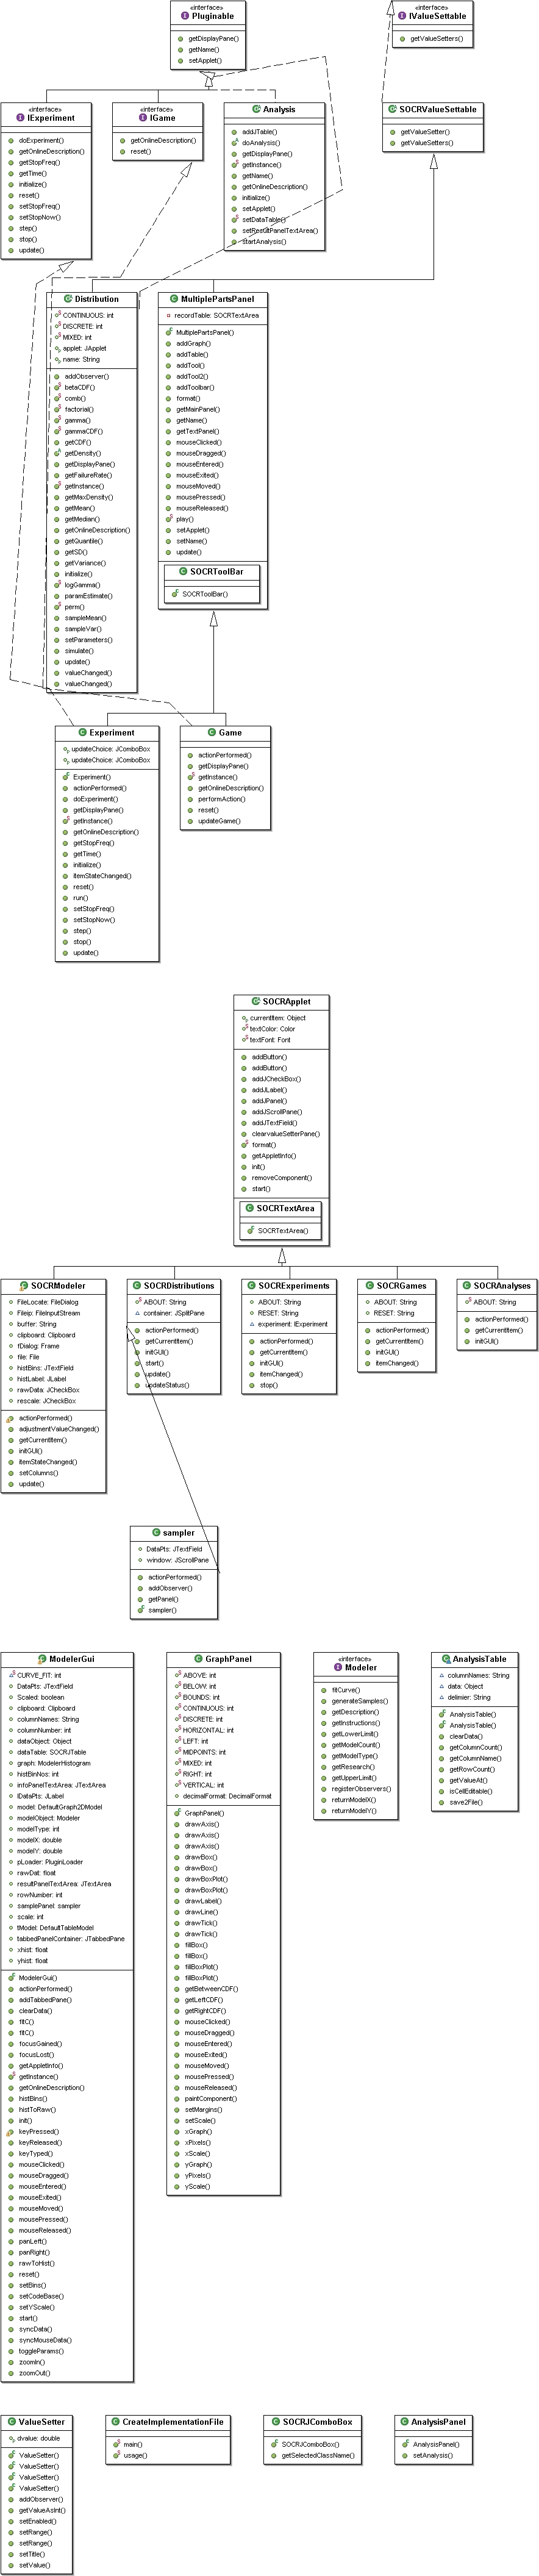
Polymorphism is applied in the SOCR Analysis model design. The main class is called edu.ucla.stat.SOCR.analyses.model.Analysis. For various analysis models, helper classes are created to handle each type of analysis, under both the model package, that handles the computational logic, and the result package, that handles passing-back of the computational results. Taking the Simple Linear Regression model as an example, the necessary helper classes at each side are edu.ucla.stat.SOCR.analyses.model.SimpleLinearRegression; and edu.ucla.stat.SOCR.analyses.result.SimpleLinearRegressionResult.
Figure 8 depicts the inheritance relationships and Table 3 lists the analysis classes with their package names.
In the applet GUI part, a similar mechanism is used. It takes a subclass of Result and extracts values from it. The values are then displayed in corresponding applet panels. The class naming scheme is similar to the model part but lives in a different namespace, so the two sets of classes should not cause confusion to programmers or users (Figure 9).
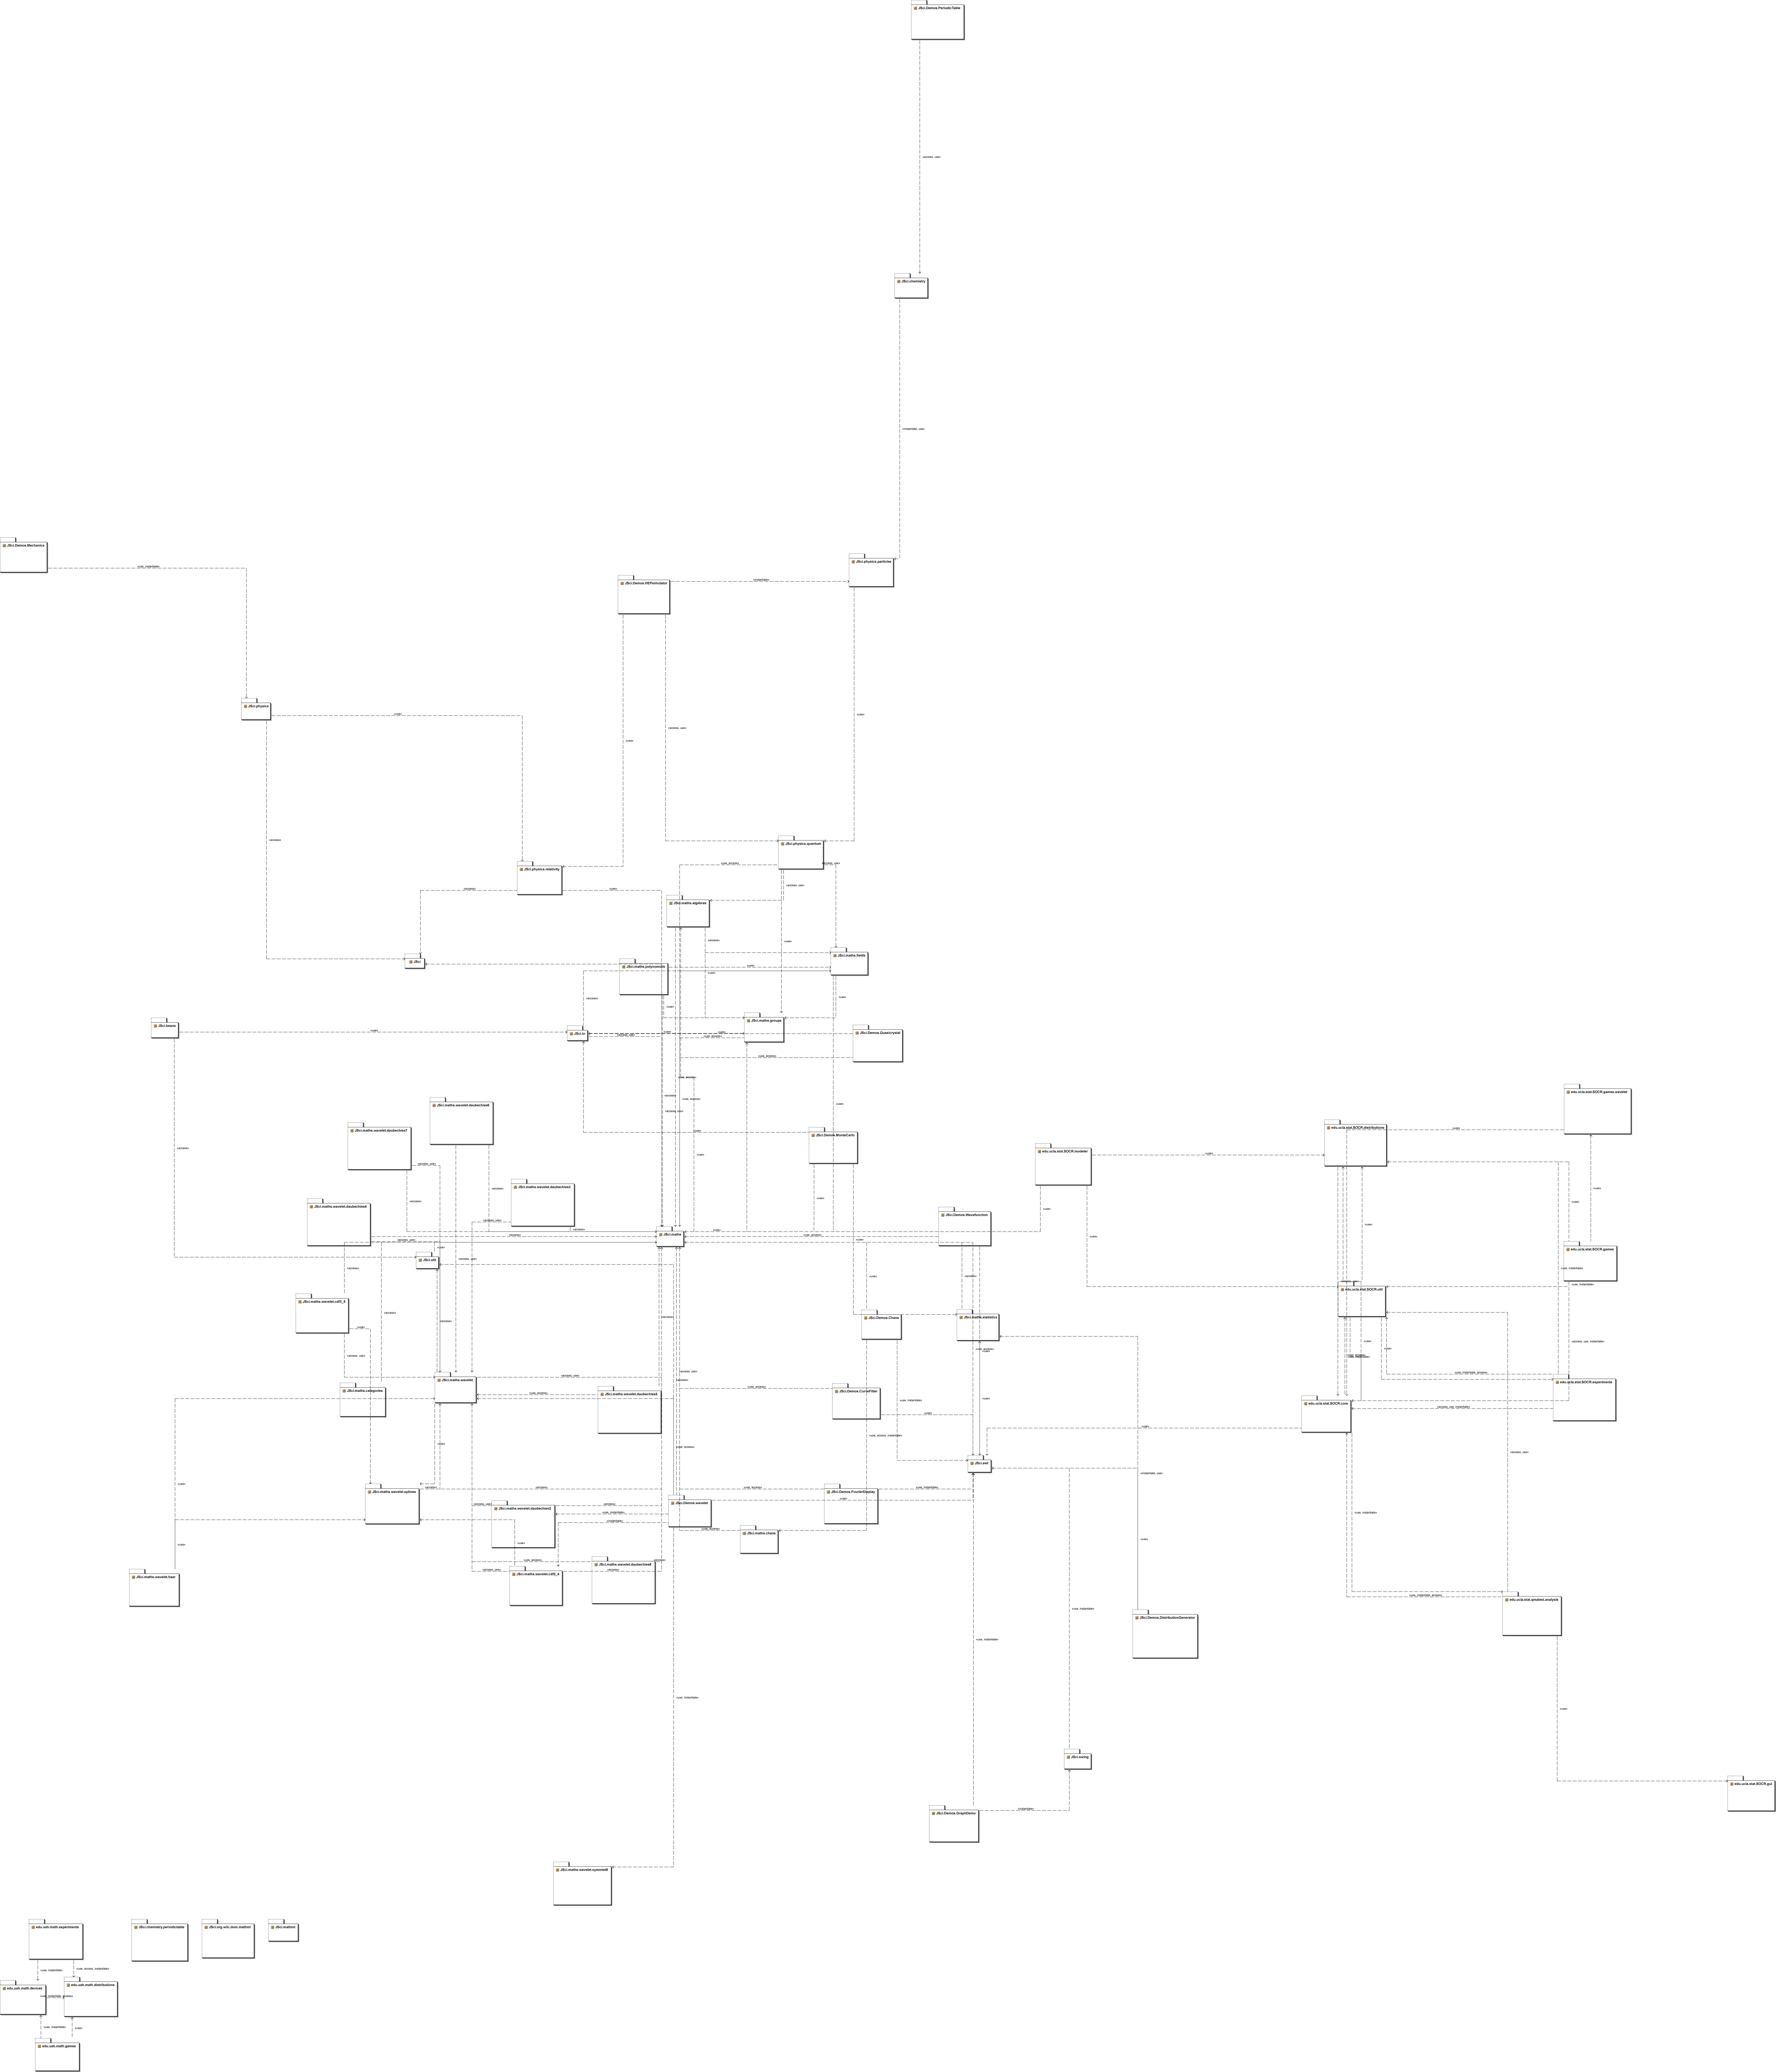
UML diagrams are created along with the development of the SOCR code base using http://www.Eclipse.org. Interested developers may find them available at:
Figure 8A: (Partial) Inheritance tree of SOCR Analysis Modeler Package
|
|
Figure 8B: (Partial) Inheritance tree of SOCR Analysis Results Package
|
 |
Figure 8. SOCR Analysis design.
Table 3. Examples of Super-Sub Class Relation.
Package
|
Super Class
|
Examples of Sub-Classes
|
edu.ucla.stat.SOCR.analyses.model
|
Analysis |
AnovaOneWay SimpleLinearRegression
OneT |
edu.ucla.stat.SOCR.analyses.result
|
Result |
AnovaOneWayResult
SimpleLinearRegressionResult
OneTResult
|
edu.ucla.stat.SOCR.analyses.gui
|
Analysis |
AnovaOneWay
SimpleLinearRegression
OneT
|
The SOCR Analyses tool relies on implemented code of other SOCR components (e.g. SOCR Distribution, SOCR Experiments, etc.) to handle probability and modeling calculations. Many of these previously built utility classes are reused in Analyses. For the graphical display of modeling diagnostic, we also employ SOCR Charts, a SOCR house-tailored component based on the JfreeChart project (www.jfree.org/jfreechart/).
Computational Implementation of SOCR Analyses
The main purpose of SOCR is to improve undergraduate statistics learning experiences. Thus, the Analyses and other SOCR resources are developed along with the general topics taught in a typical undergraduate probability or statistics course. The currently available analyses tools include several categories: linear models, comparison of samples for parametric and non-parametric testing, categorical analysis, power analysis, survival analysis using the Kaplan-Meyer model, etc. The implementation of all 18 current SOCR Analyses is summarized in Table 4.
Figure 9. SOCR Analysis inheritance tree of GUI package (partial).
Table 4. Implementation of SOVR Analyses.
SOCR Analyses Implementation
|
Models
|
Sub-Categories and Implementation
|
Linear Models
|
One-Way ANOVA
Two-Way ANOVA
Simple Linear Regression
Multiple Linear Regression |
Sample Comparison
|
|
Parametric |
Non-Parametric |
Independent Samples |
(pooled or unpooled) T-test
|
Wilcoxon Rank Sum Test;
Kruskal-Wallis Test |
Paired Samples |
(paired) T-test |
|
Categorical Data Analysis
|
Chi-Square Test for Independence and Homogeneity
Chi-Square Test for Goodness of Fit
Fisher's Exact Test
Proportion Test |
Power Analysis
|
Normal Distribution |
Other Analyses
|
Survival Analysis |
As the SOCR Analyses source code is open source (http://socr.googlecode.com), users may use the SOCR Analyses Functionality as an application or as external computational libraries, instead of interfacing these resources via a browser GUI. One of the simplest SOCR analyses is the One-sample T-test and its Java code demonstrates a call to the analysis class, Figure 10. More examples of the other analyses can be found on the SOCR Wiki Page http://wiki.stat.ucla.edu/socr/index.php/SOCR_Docs.
Figure 10 is a step-by-step instruction on making analysis calls. The default One-Sample T-Test implemented here compares the sample mean to 0 (H o: m = 0 ). The user may optionally choose another number ( m ≠ 0 ). An initialization of the Data object is needed before any data is entered, done in step (1). Then we use one of the append command provided by the Data class to append the data, done in step (2). An option to set the null hypothesis ( m ) is provided in step (3). The Result object in step (4) has data stored in HashMap. Methods in steps (5), (6) and (7) retrieve data from the Result object. Step (8) specifies an Exception thrown for the situation of empty data, non-numerical input, etc. All the other analyses have similar way of calling and result retrieval.
More examples on the other analyses can be found on the SOCR Wiki Page, where details and API documentation are provided. For additional examples, please browse the SOCR Wiki page, under the Documentation category (http://wiki.stat.ucla.edu/socr/index.php/SOCR_Docs). New information is regularly uploaded online.
Figure 10. Example code of SOCR one-sample T-test.
Conclusions and Discussion
There is a body of evidence that demonstrates the power of technology enhanced education to improve student motivation and learning retention (Brescia 2006; Cutrim 2006; Dinov 2008). Contemporary information technology-driven educational resource include web-based lecture notes, homework assignments, course-specific Internet sites (Aliaga 2005; Moore 2006) and varieties of dynamic, linked
and interactive learning materials with multi-portal access (Dinov 2008). The modern IT infrastructure enables the integration of course materials (e.g., Blackboard, Moodle), complete online courses (e.g., www.uclaextension.edu), Wiki resources (e.g., http://wiki.stat.ucla.edu/socr), interactive video streams (e.g., http://duber.com/LetsTalk), audio-visual services, real-time educational blogs (e.g., www.pbs.org/teachersource/learning.now), web-based resources for blended instruction (e.g., http://en.wikibooks.org/wiki/Blended_Learning_in_K-12), virtual office hours with instructors (e.g., http://voh.chem.ucla.edu), collaborative learning environments (e.g., http://sakaiproject.org), test-banks and exam-building tools (e.g., http://sourceforge.net/projects/tcexam) and resources for monitoring and assessment of learning (e.g., www.opensymphony.com/webwork).
Probability and statistics education presents a perfect use-case for blending technology in the instructional curriculum as there is clear need for hands-on interactive demonstrations, synergistic mathematical, computational and analytical demonstrations, as well as large-scale data manipulations (e.g., analysis, visualization). In response for these needs, the SOCR resource has developed three main Internet-based and freely accessible integrated components - learning materials, computational libraries and instructional resources. The SOCR resources materials have been successfully utilized in various probability and statistics education courses (Dinov 2008; Christou 2007).
As part of SOCR, the Analyses toolbox has been developed for a comprehensive integration of various popular analyses to serve the education and statistical computing community. As SOCR is a constantly evolving project, we will be implementing more data models in the future. However, SOCR Analyses can already offer much more than the basic in a standard undergraduate course. To enhance SOCR Analyses, we will be adding additional built-in examples, additional GUIs and regression diagnostic visualization components. Researchers and students around the world use the Analysis GUI on the Web or downloaded libraries offline, and employ these tools for their research or educational needs. We have been continuously receiving aspiring comments, questions and suggestions from the wide community of over 250,000 SOCR Applets and over 800,000 SOCR Wiki resource users since 2003. All SOCR developments, vision and educational efforts are dependent on the input of this community.
In addition to these Java-based SOCR Analyses, the authors are extending this framework to provide a SOCR-R Analyses interface, which is a server-based tool that will integrate the free statistical package R (www.R-project.org) into SOCR. While SOCR Analyses have all the computations running at the client (browser) side, SOCR-R Analyses will employ the R software at the server side, allowing the client code to only handle the GUI and delegating the statistical computation to the remote SOCR-R server. The SOCR-Java-R-Interface will be built in-house using XML communication protocols using Java.sun.com, www.R-project.org and XML (www.w3.org). The benefit of dispatching all the statistical computation to R is to free our application from rewriting code of the same functionality, saving development time and improving the resource quality. Specifically speaking, our source code already has the design finished and the framework developed. To add a new analysis, one needs to write an XML file and provide a Java class that enables the interface to the corresponding R analysis calculations. All the R functionalities have already been thoroughly tested with computation speed and reliability by the statistics community. Therefore, the SOCR-Java-R-Interface development and quality assurance may be accomplished very efficiently.
Acknowledgments
These new SOCR Analyses were designed and implemented with support from the National Science Foundation grants DUE 0716055 and 0442992, and from the National Institutes of Health, Roadmap for Medical Research, NCBC Grant U54 RR021813. We are also thankful to the numerous users, students, collaborators and instructors who have provided feedback, critiques and ideas about SOCR Analyses in the past several years. The authors appreciate the JOLT editors’ contributions that significantly improved the flow of the manuscript.
References
Aliaga M, Cobb G, Cuff C, Garfield J, Gould R, Lock R, Moore T, Rossman A, Stephenson B, Utts J, Velleman P & Witmer J (2005). “Guidelines for Assessment and Instruction in Statistics Education College Report.” Technical report, American Statistical Association.
Brescia W & Miller M (2006). “What's It Worth? The Perceived Benefits of Instructional Blogging." Electronic Journal for the Integration of Technology in Education, 5, 44-52.
CAUSE (2007). Consortium for the Advancement of Undergraduate Statistics Education. http://www.causeweb.org/.
Christou N, Sanchez J & Dinov I (2007). “Design and Evaluation of Undergraduate Probability and Statistics Courses using SOCR Tools.” International Statistics Institute meeting, Lisbon, Portugal.
Conover W (1980). “Practical Nonparametric Statistics.” John Wiley & Sons, New York, second edition.
Cutrim E, Rudge D, Kits K, Mitchell J & Nogueira R (2006). “Changing Teaching Techniques and Adapting New Technologies to Improve Student Learning in an Introductory Meteorology and Climate Course.” Advances in Geosciences, 8, 11-18. Dinov I (2006). SOCR: Statistics Online Computational Resource." Journal of Statistical Software, 16(1), 1-16.
Dinov I, Sanchez J & Christou N (2008). “Pedagogical Utilization and Assessment of the Statistics Online Computational Resource in Introductory Probability and Statistics Courses.” Journal of Computers & Education, 50, 284-300.
Hoel P (1984). “Introduction to Mathematical Statistics.” John Wiley & Sons, New York, fifth edition.
Jennrich R (1995). “An Introduction to Computational Statistics.” Prentice-Hall, New Jersey.
Moore M (2006). “Adoption of New Technologies in Instructional: A Case Study of Communications Faculty at Florida Community College at Jacksonville Integrating an Instructional Web-based Writing Tool.” My ACCESS into Communications Courses. Ph.D. thesis.
Pezzullo J (2007). “Free Statistical Software.” http://statpages.org/.
Eclipse The Eclipse Foundation (2007). “Eclipse.” http://www.eclipse.org.
Java Sun Microsystems (1994-2007). “Java.” http://java.sun.com/. JFreeChart JFree (2007). “JFreeChart.” http://www.jfree.org/jfreechart/.
The R Foundation (2003). “R.” http://www.r-project.org.
XML World Wide Web Consortium (W3C) (1998-2008). “XML.” http://www.w3.org/.
Rice J (1995). “Mathematical Statistics and Data Analysis.” Duxbury Press, Bermont California, second edition.
Shackman G (2008). “Free Software.” http://gsociology.icaap.org/.
Venables W & Ripley B (2002). “Modern Applied Statistics.” Springer, New York, fourth edition.
Wu C & Hamada M (2002). “Experiments.” John Wiley & Sons, New York, fourth edition.
|
