|
 |
MERLOT Journal of Online
Learning and Teaching |
Vol.
6, No. 3, September 2010
|
A Study of Students’ Learning Styles, Discipline Attitudes and Knowledge Acquisition in Technology-Enhanced Probability and Statistics Education
Un Estudio sobre Los Estilosd de Aprendizaje de los Alumnos, Actitudes de Disciplina y Obtención de Conocimiento de la Probabilidad de Tecnologia-Mejorada y Educación Estadística
|
Nicolas Christou
Statistics Online Computational Resource
University of California, Los Angeles
Los Angeles, CA 90095 USA
|
Ivo D. Dinov
Statistics Online Computational Resource
Center for Computational Biology
University of California, Los Angeles
Los Angeles, CA 90095 USA
dinov@stat.ucla.edu
|
|
Abstract
Many modern technological advances have direct impact on the format, style and efficacy of delivery and consumption of educational content. For example, various novel communication and information technology tools and resources enable efficient, timely, interactive and graphical demonstrations of diverse scientific concepts. In this manuscript, we report on a meta-study of 3 controlled experiments of using the Statistics Online Computational Resources in probability and statistics courses. Web-accessible SOCR applets, demonstrations, simulations and virtual experiments were used in different courses as treatment and compared to matched control classes utilizing traditional pedagogical approaches. Qualitative and quantitative data we collected for all courses included Felder-Silverman-Soloman index of learning styles, background assessment, pre and post surveys of attitude towards the subject, end-point satisfaction survey, and varieties of quiz, laboratory and test scores. Our findings indicate that students’ learning styles and attitudes towards a discipline may be important confounds of their final quantitative performance. The observed positive effects of integrating information technology with established pedagogical techniques may be valid across disciplines within the broader spectrum courses in the science education curriculum. The two critical components of improving science education via blended instruction include instructor training, and development of appropriate activities, simulations and interactive resources.
Keywords: statistics education, SOCR, blended instruction, IT teaching, evaluation and assessment, learning styles, applets.
|
Resumen
Muchos avances tecnológicos modernos tienen impacto directo sobre el formato, estilo y eficacia de la entrega y consumo de contenido educacional. Por ejemplo, varias herramientas y recursos nuevos de información tecnológica y comunicacionales permiten demostraciones eficientes, oportunas, interactivas y gráficas de diversos conceptos científicos. En este manuscrito, informamos un estudio-meta de 3 experimentos controlados utilizando Statistics Online Computational Resources (Recursos Computacionales Estadísticos Online) en cursos de probabilidades y estadísticas. Se utilizaron dispositivos SOCR accesibles en la WEB, demostraciones, simulaciones y experimentos virtuales en diferentes cursos como tratamiento y se compararon a clases de control igualadas utilizando enfoques pedagógicos tradicionales. Se recopilaron datos cualitativos y cuantitativos de todos los cursos incluyendo el index de estilos de aprendizaje de Felder-Silverman-Soloman, evaluación de antecedentes históricos, investigaciones antes y después de la actitud hacia la materia., investigación de satisfacción final, y puntajes obtenidos en una variedad de interrogaciones, pruebas de laboratorio y tests. Nuestros descubrimientos indican que los estilos de aprendizaje de los alumnos y las actitudes hacia una disciplina pueden ser importantes componentes del desempeño cuantitativo final. Los efectos positivos observados de integrar la tecnología de información con técnicas pedagógicas establecidas pueden ser válidos a través de las disciplinas en los cursos de amplio espectro en el curriculum de la ciencia de la educación. Los dos componentes críticos para mejorar la ciencia de la educación a través de una instrucción combinada incluyen capacitar al instructor, y el desarrollo de actividades, simulaciones y recursos interactivos para la comprensión de los datos.
Palabras claves: educación estadística, SOCR, instrucción combinada, enseñanza IT y evaluación, estilos de aprendizaje, dispositivos. |
|
Introduction
Modern scientific, biomedical and humanitarian college curricula demand the integration of contemporary information technology tools with proven classical pedagogical approaches. This paradigm shift of blending established instructional instruments with novel technology-based instruction is fueled by the rapid advancement of technology, the ubiquitous use of the Internet in various aspects of life and by economic and social demands (Ali, 2008; Dinov, 2008; Santos et al., 2008) . The proliferation of diverse contemporary methods for teaching with technology is coupled with the need for scientific assessment of these new strategies for enhancing student motivation and improving quality of the learning process and extending the time of knowledge retention (Dinov et al., 2008; Orlich et al., 2009) .
The Statistics Online Computational Resource (SOCR)is a national center for statistical education and computing located at the University of California, Los Angles (UCLA). The goals of the SOCR project are to design, implement, validate and widely distribute new interactive tools and educational materials. SOCR efforts are focused on producing new and expanding existing Java applets, web-based course materials and interactive aids for technology enhanced instruction and statistical computing (Che et al., 2009a; Dinov, 2006; Dinov and Christou, 2009) . Many SOCR resources are useful for instructors, students and researchers. All of these resources are freely available and anonymously accessible over the Internet (www.SOCR.ucla.edu).
SOCR is composed of four major components: computational libraries, interactive applets, hands-on activities and instructional resources. External programs typically use the SOCR libraries for statistical computing (Ho et al., 2010) (Sowell et al., 2010) (Che et al., 2009b) . The interactive SOCR applets are further subdivided into six suites of tools: Distributions, Experiments, Analyses, Games, Modeler and Charts (www.SOCR.ucla.edu). Dynamic Wiki pages, http://wiki.stat.ucla.edu/socr/, contain the hands-on activities and include a variety of specific instances of demonstrations of the SOCR applets. The SOCR instructional plans are collections composed of lecture notes, documentations, tutorials and guidelines about statistics education, e.g., the Probability and Statistics EBook: http://wiki.stat.ucla.edu/socr/index.php/EBook.
In this study, we investigate the effects of learning styles, teaching with technology, interactive simulations and quantitative measures of student performance in IT-blended probability and statistics classes. We also collected attitude data towards the subject at the beginning and the end of the quarter to determine the initial and final state of the students’ perception of the subject of probability and statistics, as a quantitative discipline. The first specific research question we address is whether there is significant evidence that technology enhanced instruction facilitates knowledge retention, boosts motivation and improves student satisfaction (and if so, what is the practical size of the IT-instruction effect). The second question we tackle is whether there are learning-style specific effects that may influence the quantitative outcomes of traditional or IT-enhanced instruction.
The rapid technological advancements in recent years have led to the development of diverse tools and infrastructure of integrating science, education and technology. This in turn has expanded the variety of novel methods for learning and communication. Such recent studies (Blasi and Alfonso, 2006; Dinov et al., 2008; Schochet, 2008) have demonstrated the power of this new paradigm of IT-based blended instruction. In the field of statistics educational research, there are a number of excellent examples of combining new pedagogical approaches with technological infrastructure that improve student motivation and enhance the learning process (Kreijns et al., 2007; Meletiou-Mavrotheris et al., 2007) .
The list of new technologies for delivering dynamic, linked, interactive and multidisciplinary learning content is large and quickly growing. Examples of such new IT resources include common web-places for course materials (BlackBoard, 2008; Moodle, 2008) , complete online courses (UCLAX, 2008) , Wikis (SOCRWiki, 2008) , interactive video streams (LPB, 2008; YouTube, 2008) , audio-visual classrooms, real-time educational blogs (EduBlogs, 2008; TechEdBlogs, 2008) , web-based resources for blended instruction (WikiBooks, 2008) , virtual office hours with instructors (VOH, 2008) , collaborative learning environments (SAKAI, 2008) , test-banks and exam-building tools (MathNetTestBank, 2008) and resources for monitoring and assessment of learning (ARTIST, 2008; WebWork, 2008) .
The Felder-Silverman-Soloman Index of Learning Styles (Felder, 1998; Felder, 2003) is a self-scoring instrument that assesses student learning preferences on a four dimensional scale – Sensing/Intuiting, Visual/Verbal, Active/Reflective and Sequential/Global. There are web-based and paper versions of the ILS, which may be utilized in various types of courses (http://www.ncsu.edu/felder-public/ILSpage.html).
The ILS allows instructors who assess the overall behavior of each class, adapt their teaching style to cover as much of the spectrum on each of the four dimensional axes as possible. Of course, this requires a commitment of time, resources and willingness to modify course curricula. Appropriate pedagogical utilization of the ILS may optimize and enhance the instructional process – i.e., targeted, enriched and stimulating learning environment may impact majority of students (Felder, 1998) . Each student completed the online ILS questionnaire consisting of 44 questions at the beginning of their Fall 2006 classes. Based on the answers they provided they received a score from –11 to 11 for each one of the four ILS categories: S1: Active-reflective (a score closer to +11 indicates that the student is more reflective than active); S2: Sensing-intuitive; S3: Visual-verbal; and S4: Global-sequential. We studied the overall students’ quantitative performance against several independent variables (the four categories S1, S2, S3, S4, and students’ attitudes towards probability and statistics).
There are different types of frameworks for describing learning styles of students, trainees and more generally – learners. Most of these define a learning style as some description of the perception, attitude and behavior on the part of the learner, which determines the individual's preferred way of acquiring new knowledge (Cassidy, 2004; Honey and Mumford, 1982; Knowles and Smith, 2005; Sims, 1995) . Individual learning styles are indirect reflections of various cognitive and psychological factors. A learning style typically indicates an individual’s approach to responding to new learning stimuli. A very comprehensive and comparative review of many classical and contemporary models and theories of learning styles is available in (Cassidy, 2004) . This study provides a detailed description of the commonalities and differences of many learning style instruments based on their measurements, appropriate use and interpretation. It provides a broader appreciation of learning styles and discusses various instruments for measuring learning styles. One example of an interactive learning style survey is VARK (VARK, 2008) , which is a questionnaire that provides users with a profile of their learning preferences based on self-assessment of preferences to take-in or give-out information.
In the past, we have conducted several experiments where we studied student behaviors, learning preferences and comprehension based on IT enhanced curricula. One prior large-scale study (Dinov et al., 2008) assessed the effectiveness of SOCR as an IT tool for enhancing undergraduate probability and statistics courses using different designs, and different classroom environments. We observed good outcomes in student satisfaction and use of technology in all three SOCR-treatment courses, compared to control sections exposed to classical instruction. In SOCR-treated courses, we found improved overall performance in the class, compared to matched traditional instruction. The treatment effect was very statistically significant, as the SOCR-treatment groups consistently performed better than the control group for all sections and across all assignments. The practical size of the observed IT-treatment effect was 1.5-3% improvement, modulated by a statistically significant p-value < 0.001 using a conservative non-parametric test. In this prior study, there were no statistically significant group differences in the overall quantitative assessment between the treatment and control groups, which could have been due to limited statistical power or lack of control for the learning styles. Yet, pooling the results across all courses involved in the experiment we saw a consistent trend of improvement in the SOCR treatment group (Dinov et al., 2008) .
In this manuscript, we report on the use of the ILS and various other categorical measurements to evaluate the associations between student performance, learning style and attitude towards the subject in several undergraduate probability and statistics courses.
Methods
Here we report on our findings of using the SOCR resources as instruments for IT-blended instruction in several courses. UCLA Institutional Review Board (IRB) approval was obtained to collect the appropriate data and conduct this study (IRB 05-396B/08-28-2006). Individual classes varied somewhat in their intrinsic designs, but generally, our courses included beginning of the quarter quizzes, ILS assessment, standard quarter-wide learning evaluation quantitative measures (exams, quizzes, homework, etc.), beginning and ending attitude towards the subject surveys. These common characteristics of our design are described below, and the course-specific design traits are presented in the Results section. At the end, Table 22 summarizes our study-design and research-findings in three probability and statistics courses.
Beginning of the quarter quiz
Each Fall 2006 course administered an entry subject-specific quiz (first day of classes) to assess background knowledge within the student population. The questions on these quizzes aimed at determining the appropriate elementary knowledge of probability and statistics, according to the course-specific prerequisites. These quizzes consisted of less than 10 questions and required about 15 minutes to complete. Example questions of an entry quiz are included in Box 1. As these quizzes were given only to the treatment groups, see below, the results were only used to predict students’ overall quantitative performance of their corresponding class. The goal of the quiz was to assess students’ prior knowledge of probability and statistics. It was an attempt to find a predictor for students’ future performance in the course. However, as shown later in the paper, the quiz scores did not show an association with the overall students’ performance.
1 . Which of the following sequences is most likely the result from flipping a fair coin 5 times?
- HHHTT
- THHTH
- THTTT
- HTHTH
- All four sequences are likely.
2 . A small object was weighed on the same scale separately by 9 students in a science class. The weights (in grams) recorded by each student are shown below.
6.2 |
6 |
15.3 |
6.1 |
6.3 |
6.2 |
6.15 |
6.2 |
The students want to determine as accurately as they can the actual weigh of this object. Which of the following methods should they use? Explain!
- Use the most common number, which is 6.2
- Use the 6.15 since it is the most accurate weighing
- Add up the 8 numbers and divide by 8
- Throw out the 15.3, add up the other 7 numbers and divide by 7
- Use 6.2 as it’s the number in the middle of the ordered sequence.
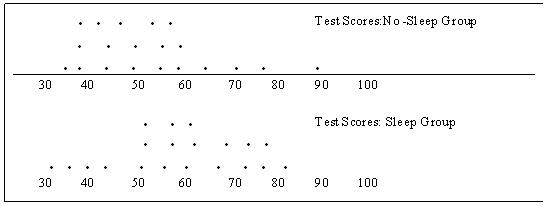
3. Forty college students participated in a study of the effect of sleep on test scores. 20 of them volunteered to stay up all night studying the night before the test (no-sleep group). The other 20 students (control group) went to bed by 11:00 pm on the evening before the test. The test scores for each group are shown on the graph below. Each dot on the graph represents a particular students’ score. Examine the two graphs carefully. Then choose from the 6 possible conclusions listed below the one you most agree with.
- The no-sleep group did better because none of these students scored below 40 and the highest score was achieved by a student in this group.
- The no-sleep group did better because its average appears to be a little higher than the average of the sleep group.
- There is no difference between the two groups because there is considerable overlap in the scores of the two groups.
- There is no difference between the two groups because the difference between their averages is small compared to the amount of variation in scores.
- The sleep group did better because more students in the group scored 80 or above.
- The sleep group did better because its average appears to be a little higher than the average of the non-sleep group.
|
|
Box 1. Example questions of a beginning of the quarter quiz for assessing background student knowledge. |
Learning Style Assessment
The ILS index is based on a model of learning, where students’ learning styles are defined by their answers to four classes of questions:
-
Information processing: active (through engagement in physical activity and discussion), or reflective (through self-examination);
-
Type of preferential information perception: sensory (sights, sounds, physical sensations), or intuitive (possibilities, insights, hunches);
-
Preferred external information sensory channel: visual (pictures, diagrams, graphs, demonstrations), or auditory (words, sounds);
-
Understanding process: sequential (continual steps), or global (generative/holistic approach).
The ILS allows instructors who assess the overall behavior of each class, and perhaps adapt their teaching style to cover as much of the spectrum on each of the four dimensional axes as possible. Of course, this requires a commitment of time, resources and willingness to modify existent course curricula. If the ILS assessment is appropriately utilized in class, it is reasonable to assume that the instructional process is generally as optimal as possible – i.e., the learning environment is enriched and stimulating for most students in the class (Felder, 1998) .
Exam scores
All students enrolled in the traditional (control) or IT-enhanced (SOCR-treatment) groups took the same types of quantitative assessments including homework, laboratory assignments and exams. There were small variations between the gradebook allocations between the two separate studies/instructors, however, the control vs. treatment effects were only analyzed within class type and within each instructor. Instructors ensured that exams given to pairs of control-treatment courses were comparable and consistent (but not identical).
Pre, post and satisfaction Surveys
The pre- and post-attitude surveys were conducted at the beginning and the end of the quarter, respectfully. These were designed to inform us of students’ mental position and emotion towards the subject of probability and statistics. The ordinal responses ranged from 1 (strongly disagree), through 4 (neither disagree nor agree) to 7 (strongly agree). These surveys took less than 10 minutes each. Box 2 shows an example of our attitude questionnaire. Paired comparisons of these responses are indicative of potential alterations on the learners’ philosophical and behavioral positions towards the educational discipline.
| |
Strongly Disagree |
Neutral |
Agree |
| 1. I will like statistics/probability |
1 2 |
3 4 5 |
6 7 |
| 2. Statistics/probability is worthless. |
1 2 |
3 4 5 |
6 7 |
| 3. Statistics/probability is a complicated subject. |
1 2 |
3 4 5 |
6 7 |
| 4. Statistics/probability is an easy to learn subject |
1 2 |
3 4 5 |
6 7 |
| 5. Statistical/probability skills will make me more employable. |
1 2 |
3 4 5 |
6 7 |
6. Statistics/probability will be irrelevant in my job
(or future job). |
1 2 |
3 4 5 |
6 7 |
| 7. Statistical/probability thinking is not applicablen in my life outside my job (or future job). |
1 2 |
3 4 5 |
6 7 |
| 8. I use statistics/probability in my everyday life |
1 2 |
3 4 5 |
6 7 |
9. I have no idea of what's going on in statistics/probability.
|
1 2 |
3 4 5 |
6 7 |
10. I rarely get frustrated going over statistics tests in class.
|
1 2 |
3 4 5 |
6 7 |
Box 2: The pre and post attitude survey.
Finally, we conducted a satisfaction survey (sat) at the end of the quarter that aimed at comparing the treatment and control classes to other similar courses. Box 3 shows example questions that were included in this questionnaire. Responses on these 10-minute surveys could be used for comparing the treatment and control groups, as well as for evaluating the relation of the two pedagogical approaches to analogous types of classical or IT-based instruction.
A. Compared with other classes where instructors have not required using technological tools like applets or software for some homework, how would you rate the overall effectiveness of the use of the technology according to the following: |
|
Higher |
The
Same |
Lower |
NA |
(a) In understanding the main concepts of the course |
|
|
|
|
(b) In exams grades |
|
|
|
|
(c ) In homework grade |
|
|
|
|
(d) In motivating you to learn the material |
|
|
|
|
(e) In considering statistics as a possible major/minor |
|
|
|
|
(f) In motivating you to attend class |
|
|
|
|
(g) In Motivating you to network with fellow students |
|
|
|
|
(h) In stimulating your intellectual curiosity |
|
|
|
|
(i) In Providing you with content needed for your area of study |
|
|
|
|
(j) In maintaining your attention during class |
|
|
|
|
(k) In relating the course material to other materials studied in other classes |
|
|
|
|
B. Please, check one
|
1. Was this class More interesting or Less interesting than other applied math classes that you have taken?
2. Was this class Harder or Easier than other applied mathematics classes that you have taken?
3. Did this Probability class teach you More or Less things relevant to your own life than other applied mathematics classes ?
4. Has this class helped you understand better the world around us? Yes No
5. Would you take another applied probability class after this one if you had a chance (meaning a class where you would do more real world applications of probability to acquiring knowledge in different contexts such as industry, weather, government decision-making, etc)? Yes No
6. What in the material of this course do you consider to be the piece of knowledge that will help you the most in your life? Please write your answer below. |
Box 3: End-of-quarter satisfaction survey.
SOCR Treatment
The SOCR treatment involved three types of strategies blending traditional and technology-enhanced pedagogical strategies. First, demonstrations of interactive SOCR applets, simulations, virtual experiments and tools were shown during lecture (3 hrs/week). These demos were interleaved with the standard (control-type) instructional materials. Second, the discussions and laboratory classes (1-2 hrs/week), lead by teaching assistants, provided hands-on activities where students tested the applets and discussed of the probability and statistics concepts demonstrated by the corresponding interactive SOCR resources. Third, all homework assignments and projects required the use of the interactive SOCR web tools. In their assignments, students were asked to include and interpret snapshots of the final states of the appropriate SOCR applets or simulations they used to complete their projects. The control (traditional) treatment classes used classical instruction based on standard lecture/discussion format without hands-on technology demos or requirements for using web applets for completing papers and assignments. However, the controlled classes were shown graphs, results and computer outputs during class time.
Results
Statistics 13 classes
In the Fall of 2006 we had two distinct SOCR-treatment Statistics 13 courses (Dinov and Christou), which were compared against classical instruction, by the same instructors (Fall 2005 and Winter 2006, respectively). The general description of the course and the section-specific results and findings for this sequence are discussed below.
Statistical Methods for the Life and Health Sciences (UCLA Stats 13) is an introductory course on statistical methods for the life and health sciences. Most enrolled students are bound for medical, graduate and professional schools after completing their undergraduate curricula. Brief outline of the course is available online at http://www.registrar.ucla.edu/archive/catalog/2005-07/catalog/catalog05-07-7-98.htm and the section-specific information is listed below. Each of the two sections in this study had about 90 students that received five hours of instruction a week – three lectures, one discussion and one laboratory. For discussion and laboratory, each section was split into three sub-sections conducted by teaching assistants. All students were assessed using the same gradebook schema and grade distribution. SOCR tools were used in lecture for demonstration, motivation and data analysis, as well as for projects, labs and homework.
Statistics 13.1 (Dinov) The complete course description, coverage, assignments, class-notes, grading schema and all course related materials are available online at http://courses.stat.ucla.edu/06F/stat13_1.
Table 1 depicts the distribution of the students in Stats 13.1 at the end of the quarter. The Fall 2006 (Fall 2005) classes started with a total enrollment of 90 students in the beginning of the quarter. There were significant differences between the treatment (2006) and control (2005) groups in the students’ seniority-rankings (p-value < 0.001), but no significant differences in the majors distributions.
Table 1 : Stats 13.1 student demographics (treatment and control groups). The values in table represent the enrollment in the Fall 2006 vs. (Fall 2005) classes, respectively.
|
Freshmen |
Sophomores |
Juniors |
Seniors |
Graduate |
Total |
Undeclared |
3 (2) |
3 (1) |
1 (4) |
2 (1) |
0 (0) |
9 (8) |
Math & Physics |
1 (2) |
2 (2) |
1 (2) |
2 (1) |
1 (1) |
7 (8) |
Neuroscience |
0 (1) |
2 (1) |
1 (1) |
1 (0) |
0 (0) |
4 (3) |
Humanities |
0 (1) |
3 (2) |
1 (0) |
0 (1) |
0 (0) |
4 (4) |
Biology |
4 (18) |
15 (11) |
26 (10) |
8 (20) |
0 (1) |
53 (60) |
Total |
8 (24) |
25 (17) |
30 (17) |
13 (23) |
1 (2) |
77 (83) |
A uniform grading schema was used in both the Fall 2005 (control) and the Fall 2006 (SOCR treatment) Stats 13 classes (Dinov). The lowest homework project was automatically dropped (only the top 7 homework scores counted). A standard letter-grade mapping was used based on quantitative overall average (e.g., 93%+ for A; 90-93% for A -; 87-90% for B +; 83-87% for B, etc.). Homework accounted for 20%, labs for 10%, midterm-exam for 30%, research term paper for 5% and the final exam for 35% of the final grade.
All students in the Fall 2006 Stats 13.1 class were exposed to SOCR enhanced instruction (treatment group) and all students in the Fall 2005 Stats 13.1 class (same instructor, Dinov) were subjected to the standard instructional curriculum using Stata (STATA, 2008) (control group). Only the student demographics and the quantitative measures of learning (exam scores, homework, etc.) were comparable between the control and treatment groups. The ILS and attitude surveys were only available for the Fall 2006 class (treatment group).
Tables 2, 3, 4, and 5 contain the results of the background quiz, the pre and post attitude surveys and the end-of-quarter satisfaction survey for Stats 13.1 (Dinov). There were no statistically significant differences in the responses to the 10 questions in the pre and post survey attitude effects (Table 3). With exception of question e (considering statistics as a possible major/minor), the end-of-the-quarter satisfaction survey showed a consistent trend, Table 4 and Figure 1, which may indicate an increase in the motivation and improved experiences in the treatment group (compared to unrelated other classes that did not use technology). The results of Part B of the final survey, Table 5, did not indicate any significant trends or unexpected effects.
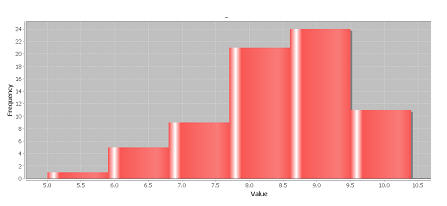
Table 2: Results of the background knowledge quiz (see Box 1). Left side shows seven standard summary statistics, and the right side illustrates a histogram plot of all scores.
Statistics |
Value |
 |
Mean |
8.197 |
SD |
1.069 |
min |
6 |
Max |
10 |
Q 1 |
7.125 |
Q 2 |
8 |
Q 3 |
9 |
Table 3: Results of the Pre vs. Post surveys (see Box 2).
Questions |
PRE |
POST |
Mean |
Median |
SD |
Mean |
Median |
SD |
Q1 |
3.9756 |
4 |
1.44027 |
4.09756 |
5 |
1.84126 |
Q2 |
1.92682 |
1 |
1.12672 |
2.65853 |
2 |
1.78339 |
Q3 |
4.75609 |
5 |
1.15716 |
4.80487 |
5 |
1.55273 |
Q4 |
3.78048 |
4 |
1.33252 |
3.80487 |
4 |
1.72074 |
Q5 |
5.43902 |
6 |
1.09655 |
4.85365 |
5 |
1.63647 |
Q6 |
2.75609 |
2 |
1.67003 |
2.65853 |
2 |
1.62187 |
Q7 |
2.53658 |
2 |
1.26683 |
2.63414 |
3 |
1.46212 |
Q8 |
4.14634 |
4 |
1.23614 |
3.92682 |
4 |
1.47292 |
Q9 |
3.07317 |
3 |
1.61849 |
2.73170 |
3 |
1.56563 |
Q10 |
3.46341 |
3 |
1.48488 |
2.82926 |
2 |
1.49837 |
Table 4: Part A results of the satisfaction survey
(see Box 3). |
Table 5: Part B results of the satisfaction survey
(see Box 3). |
PART A |
Question |
HIGHER |
SAME |
LOWER |
a |
24, (59%) |
13, (32%) |
4, (10%) |
b |
5, (12%) |
24, (59%) |
9, (22%) |
c |
16, (39%) |
21, (51%) |
4, (10%) |
d |
6, (15%) |
26, (63%) |
8, (20%) |
e |
1, (2%) |
22, (54%) |
14, (34%) |
f |
4, (10%) |
26, (63%) |
9, (22%) |
g |
4, (10%) |
29, (71%) |
5, (12%) |
h |
11, (27%) |
25, (61%) |
3, (7%) |
i |
17, (41%) |
19, (46%) |
4, (10%) |
j |
10, (24%) |
26, (63%) |
5, (12%) |
k |
9, (22%) |
24, (59%) |
5, (12%) |
|
PART B |
1 |
More interesting |
20, (49%) |
Less interesting |
21, (51%) |
2 |
Harder |
23, (56%) |
Easier |
18, (44%) |
3 |
More |
31, (76%) |
Less |
10, (24%) |
4 |
Helped understand the world |
29, (71%) |
Does not help understand the world |
12, (29%) |
5 |
Will take another applied statistics class |
14, (34%) |
Will NOT take another applied statistics class |
27, (66%) |
|
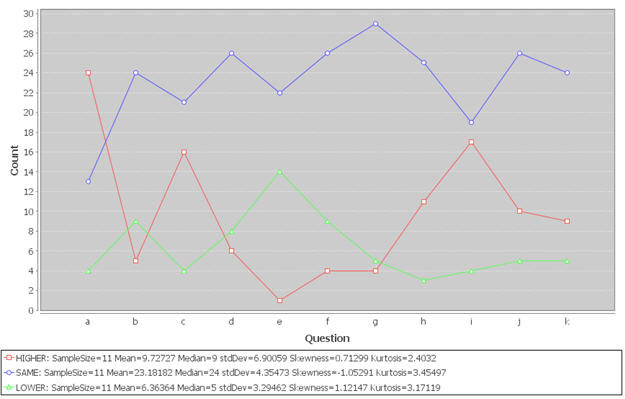
Figure 1: Plot of the end-of-quarter satisfaction survey frequencies of responses to the 11 questions
(see Box 3 and Table 4).
When comparing the quantitative learning outcomes, by type of assessment, between the treatment (Fall 2006) and control (Fall 2005) groups, we discovered mixed results. These mixed results may be partially accounted for by the fact that Statistics 13 has a required lab hour for the control group using Stata during the laboratories and lectures. This provided the control group with some exposure to technology-based instruction. The quantitative results from Dinov’s Stats 13 classes are shown in Table 6. For example, there was no statistical difference between the outcomes on the final exam, whereas there were significant differences between the treatment and the control groups in the overall and laboratory grades. The SOCR-treatment group (Fall 2006) had performed statistically significantly better than the control group, even though the practical size of the effect was within 3-5 percentage points. There were also trends of improvement on the midterm and homework scores for the treatment group; however these did not reach statistically significant levels.
Table 6: Quantitative Results measuring student learning in the two Stats 13 classes (Dinov, Fall 2005, Fall 2006). |
Assessment |
Group |
High |
Low |
Median |
Mean |
Standard Deviation |
Statistics |
Homework |
Control |
99.89 |
79.71 |
93.89 |
93.10 |
4.01 |
to = -0.85
t(157)
p=0.20 |
Treatment |
99.22 |
77.61 |
94 |
93.64 |
3.96 |
Lab |
Control |
99.5 |
78 |
94.8 |
94.14 |
4.32 |
to = -11.50
t(157)
p<0.001 |
Treatment |
100 |
96.67 |
100 |
99.83 |
0.64 |
Midterm |
Control |
100 |
53 |
84.33 |
82.87 |
13.65 |
to = -0.58
t(157)
p=0.28 |
Treatment |
99 |
60 |
84.5 |
83.93 |
8.73 |
Final |
Control |
100 |
42 |
83 |
80.17 |
16.13 |
to = 0.13
t(157)
p= 0.45 |
Treatment |
97 |
38 |
83 |
79.88 |
12.36 |
Overall Performance |
Control |
96.89 |
53.60 |
86.77 |
83.65 |
12.33 |
to = -1.71
t(157)
p=0.045 |
Treatment |
97.52 |
68.29 |
87.06 |
86.37 |
6.50 |
|
Figure 2 shows the results of the ILS assessment of the Stats 13.1 (Fall’06) SOCR-treatment section. These graphs represent the histograms for each of the 4 ILS categories. There is some evidence suggesting the majority of the SOCR treatment group students were more reflective (rather than active, S1), more intuitive (rather than sensing, S2), more verbal (rather than visual, S3), and more sequential (rather than global, S4). As the ILS survey was conducted in the beginning of classes, these self-identification results do not reflect the experience of the (treatment group) students during the quarter. There was significant evidence demonstrating the presence of positive S1, S2, S3 and S4 effects (test for proportion using Binomial distribution, with Ho: p <0 = p >0, Ha: p <0 ≠ p >0, p-values < 0.001).
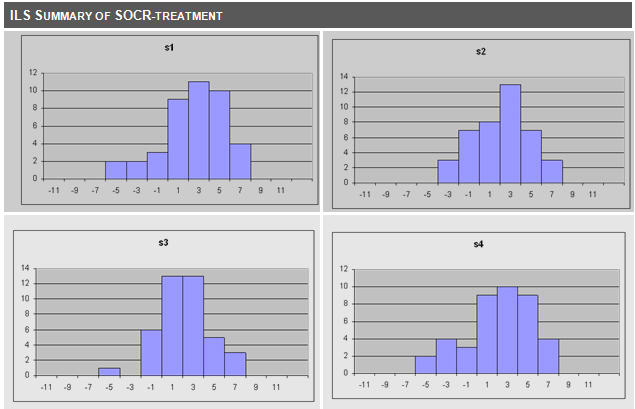
Figure 2: Histogram plots of the 4-dimensional ILS responses for the Stats 13.1 treatment group (Fall’06).
The results of the (quantitative) performance regression on ILS, pre and post attitudes and satisfaction variable (see Methods section) are shown in Table 7.
Table 7: Regression results for the ILS effects on overall quantitative performance for the Stats 13.1 (Dinov). |
Source |
SS |
df |
MS |
Number of obs = 38 F( 8, 29) = 2.17
Prob > F = 0.0608
R-squared = 0.3744
Adj R-squared = 0.2018
Root MSE = 5.555 |
Model |
535.47 |
8 |
66.93 |
Residual |
894.89 |
29 |
30.85 |
Total |
1430.36 |
37 |
38.65 |
Total |
Coefficient |
Std Err |
T |
P>| t | |
[95% Conf. Interval] |
s1 |
-0.5790 |
0.3775 |
-1.53 |
0.136 |
-1.3511 |
0.1931 |
s2 |
-0.0034 |
0.4331 |
-0.01 |
0.994 |
-0.8893 |
0.8825 |
s3 |
0.1680 |
0.4796 |
0.35 |
0.729 |
-0.8129 |
1.1490 |
s4 |
0.3958 |
0.3869 |
1.02 |
0.315 |
-0.3955 |
1.1872 |
pre |
0.6076 |
0.2401 |
2.53 |
0.017 |
0.1165 |
1.0987 |
post |
-0.3276 |
0.2747 |
-1.19 |
0.243 |
-0.8895 |
0.2342 |
sat |
-0.08824 |
0.2331 |
-0.38 |
0.708 |
-0.56514 |
0.3886 |
quiz |
1.8063 |
0.8654 |
2.09 |
0.046 |
0.036179 |
3.5764 |
_const |
64.389 |
14.987 |
4.3 |
0 |
33.73711 |
95.0422 |
|
Excluding the constant term, the only variable that was a significant predictor of overall performance at the 5% level was the initial (pre) attitude towards the discipline. The effect of the background quiz was borderline. None of the ILS spectrum variables played a significant role in explaining overall student performance. From these results, it appears as if the students’ initial demeanor and affection for using technology was the only indicative factor on their overall quantitative performance in the Statistics 13 class.
Statistics 13.2 (Christou) Most students enrolled in Statistics 13 are bound for medical, graduate and professional schools. Table 8 shows a summary of the student populations enrolled in the control (Winter 2006) and SOCR-treatment (Fall 2006) groups. Again, there were significant differences between the treatment and control groups in the students’ seniority-rankings (p-value < 0.001), but no significant differences in the majors distributions.
Table 8: Stats 13.2 student demographics. The values in table represent the enrollment in the control (Winter 2006) and SOCR-treatment (Fall 2006) classes. |
|
Freshmen |
Sophomores |
Juniors |
Seniors |
Graduate |
Total |
Undeclared |
0 (1) |
8 (3) |
3 (4) |
1 (1) |
0 (0) |
12 (9) |
Math & Physics |
0 (1) |
1 (1) |
4 (1) |
5 (7) |
0 (0) |
10 (10) |
Neuroscience |
0 (0) |
0 (0) |
1 (2) |
4 (2) |
0 (0) |
5 (4) |
Humanities |
0 (1) |
1 (0) |
0 (1) |
1 (1) |
0 (0) |
2 (3) |
Biology |
0 (3) |
23 (9) |
19 (19) |
19 (19) |
0 (0) |
61 (50) |
Total |
0 (6) |
33 (13) |
27 (27) |
30 (30) |
0 (0) |
90 (76) |
|
The final grade was computed based on three categories: homework, labs, and exams. The seven homework assignments accounted for 10% of the final grade and the six labs for another 10% of the final grade. There are five exams of which the first four were worth 15% each and the last was worth 20% of the final grade. A standard letter-grade mapping analogous to the Stats 13.1 study was used (see above).
Two classes of Statistics 13 (Winter 2006 and Fall 2006) served as control and treatment groups, respectively. The grading process was the same for both classes as described above. Both classes received three one-hour lectures per week plus one hour discussion time and one hour lab time per week. The control group was not exposed to any of the SOCR tools. The labs for the control group were done using the statistical software Stata (STATA, 2008) , while the treatment group used SOCR simulations and activities. The lectures of the SOCR treatment group frequently incorporated materials of SOCR. Besides these differences, everything else was kept the same for both groups.
Tables 9, 10, 11, and 12 contain the results of the background quiz, the pre vs. post attitude surveys and the satisfaction surveys for Stats 13.2 (Christou). With some exceptions (e.g., Q9, t-test p-value=0.03), there were no significant longitudinal attitude effects as measured by the 10 questions in the pre and post attitude survey (Table 10). Compared to Stats13.1, in this section (Stats 13.2) there was a different pattern of responses to the end-of-quarter survey. In this study, we observed a more consistent trend of increase in the motivation and improved experiences in the treatment group (compared to unrelated other classes that did not use technology), Table 11 and Figure 3. Like in the Stats 13.1 study, the results of Part B of the final survey, Table 12, did not indicate any significant trends or unexpected effects.
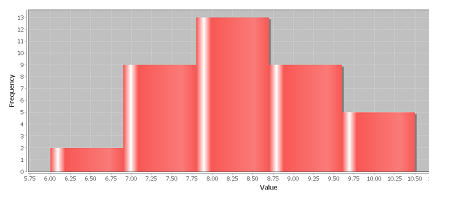
Table 9: Results of the background knowledge quiz (see Box 1). Left side shows seven standard summary statistics, and the right side illustrates a histogram plot of all scores. |
Statistics |
Value |
Mean |
8.345 |
SD |
1.145 |
min |
5 |
Max |
10 |
Q 1 |
8 |
Q 2 |
8.5 |
Q 3 |
9 |
|
|
Table 10: Results of the Pre vs. Post Attitude surveys (see Box 2). |
Questions |
PRE |
POST |
Mean |
Median |
SD |
Mean |
Median |
SD |
Q1 |
4.6486 |
5 |
1.1033 |
4.808 |
5 |
1.5152 |
Q2 |
2.4054 |
2 |
1.2487 |
2.2739 |
2 |
1.3668 |
Q3 |
4.4459 |
4 |
1.2402 |
4.5753 |
4 |
1.4329 |
Q4 |
4.1081 |
4 |
1.1050 |
4.0547 |
4 |
1.4229 |
Q5 |
4.8378 |
5 |
1.4432 |
4.7808 |
5 |
1.3968 |
Q6 |
3.1756 |
3 |
1.4176 |
3.1506 |
3 |
1.4207 |
Q7 |
2.7837 |
3 |
1.3676 |
2.5342 |
2 |
1.1794 |
Q8 |
4.2702 |
4 |
1.4267 |
4.2465 |
4 |
1.706 |
Q9 |
2.7567 |
3 |
1.2800 |
2.2191 |
2 |
1.2936 |
Q10 |
4.0675 |
4 |
1.3276 |
4.0833 |
4 |
1.8595 |
|
Table 11: Part A results of the satisfaction survey
(see Box 3 and Figure 2). |
Table 12: Part B results of the satisfaction survey
(see Box 3). |
PART A |
Questions |
HIGHER |
SAME |
LOWER |
a |
51, (70%) |
21, (29%) |
1, (1%) |
b |
22, (31%) |
44, (61%) |
6, (8%) |
c |
26, (36%) |
44, (61%) |
2, (3%) |
d |
16, (22%) |
51, (70%) |
6, (8%) |
e |
4, (6%) |
52, (80%) |
9, (14%) |
f |
18, (25%) |
49, (69%) |
4, (6%) |
g |
23, (32%) |
45, (63%) |
3, (4%) |
h |
33, (45%) |
38, (52%) |
2, (3%) |
i |
35, (50%) |
33, (47%) |
2, (3%) |
j |
30, (42%) |
38, (54%) |
3, (4%) |
k |
28, (39%) |
41, (58%) |
2, (3%) |
|
PART B |
1 |
More interesting |
60, (82%) |
Less interesting |
13, (18%) |
2 |
Harder |
24, (33%) |
Easier |
49, (67%) |
3 |
More |
66, (90%) |
Less |
7, (10%) |
4 |
Helped understand the world |
57, (78%) |
Does not help understand the world |
16, (22%) |
5 |
Will take another applied statistics class |
40, (55%) |
Will NOT take another applied statistics class |
33, (45%) |
|
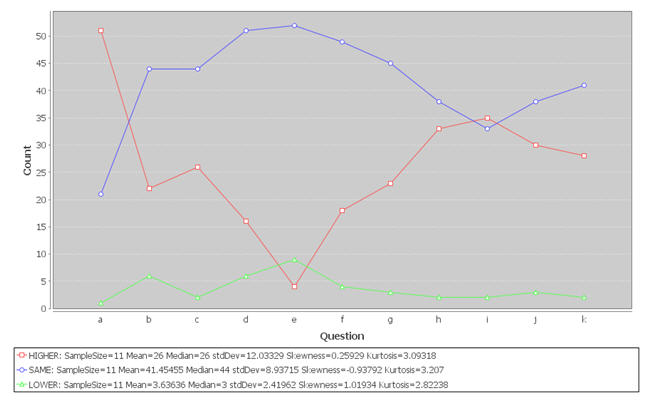
Figure 3: Plot of the end-of-quarter satisfaction survey frequencies of responses to the 11 questions
(see Box 3 and Table 11).
Table 13 shows the results of the quantitative assessment of the control and treatment groups. However, the overall performance again favors of the SOCR-treatment group. The results of exams 2 and 5, as well as the overall evaluation, provided strong evidence suggesting the treatment group performed better on these quantitative assessments.
Table 13: Quantitative Results measuring student learning in the two Stats 13 classes (Christou, Winter 2006 vs. Fall 2006). |
|
Group |
High |
Low |
Median |
Mean |
Standard Deviation |
Statistics |
Exam 1 |
Control |
100 |
44 |
83 |
81.41 |
14.05 |
to = -0.63 t(165) p=0.27 |
Treatment |
100 |
46 |
84 |
82.68 |
11.92 |
Exam 2 |
Control |
100 |
6 |
81 |
76.75 |
18.25 |
to = -5.92 t(165) p<0.001 |
Treatment |
100 |
35 |
95 |
90.86 |
12.19 |
Exam 3 |
Control |
100 |
35 |
85 |
81.61 |
14.58 |
to=-0.37 t(165) p=0.36
|
Treatment |
100 |
50 |
84 |
82.36 |
11.62 |
Exam 4 |
Control |
100 |
37 |
86 |
83.94 |
10.70 |
to=1.63 t(165)
p= 0.06
|
Treatment |
100 |
54 |
83 |
81.07 |
11.96 |
Exam 5 |
Control |
100 |
20 |
79 |
78.75 |
13.84 |
to=-4.84 t(165) p<0.001
|
Treatment |
100 |
50 |
91 |
87.80 |
10.02 |
Overall Performance |
Control |
94.31 |
43.91 |
85.42 |
82.09 |
11.6 |
to=-3.07 t(165) p=0.001
|
Treatment |
97.49 |
69.17 |
88.68 |
86.67 |
7.37 |
|
We now present the results of the analysis of the impact of the Index of Learning Styles (ILS) on students’ learning (Stats 13.2, Christou). At the beginning of the course each student completed the online ILS questionnaire consisting of 44 questions. Based on the answers they provide, each student received a score from –11 to 11 for each one of the four categories. The results of the (quantitative) performance regression on ILS, pre and post attitudes and satisfaction (see Methods) are shown on Table 14.
Table 14: Regression results for the ILS effects on overall quantitative performance for Stats 13.2 (Christou). |
Source |
SS |
df |
MS |
Number of obs = 71
F( 8, 62) = 4.01
Prob > F = 0.0007
R-squared = 0.3407
Adj R-squared = 0.2557
Root MSE = 7.1673
|
Model |
1646.1462 |
8 |
205.7682 |
Residual |
3184.98771 |
62 |
51.37076 |
Total |
4831.13391 |
70 |
69.01619 |
Total
|
Coefficient |
Std Err |
T |
P>| t | |
[95% Conf. Interval] |
s1 |
-0.67333 |
0.25711 |
-2.62 |
0.011 |
-1.1872 |
-0.15938 |
s2 |
0.21677 |
0.31709 |
0.68 |
0.497 |
-0.4170 |
0.85063 |
s3 |
0.77588 |
0.31674 |
2.45 |
0.017 |
0.1427 |
1.40903 |
s4 |
0.47413 |
0.29315 |
1.62 |
0.111 |
-0.1118 |
1.06013 |
pre |
-0.3005 |
0.2421 |
-1.24 |
0.219 |
-0.7844 |
0.18345 |
post |
0.50876 |
0.23101 |
2.2 |
0.031 |
0.0469 |
0.97055 |
sat |
-0.71649 |
0.28546 |
-2.51 |
0.015 |
-1.2871 |
-0.1458 |
quiz |
0.20205 |
0.86841 |
0.23 |
0.817 |
-1.5338 |
1.93798 |
_const |
88.89908 |
13.54295 |
6.56 |
0 |
61.827 |
115.971 |
|
The variables that were significant predictors of overall performance, at the 5% level, included the active-reflective (S1) and visual-verbal (S3) ILS measures and the attitude towards the discipline (post). The fact that the global-sequential and sensing-intuitive directions of the ILS spectrum did not play a significant role in explaining overall student performance makes the interpretation of the ILS results difficult. One possibility for explaining this observed effect is that an increase of the overall student performance directly correlates with both – a shift of the learners into the active (tendency to retain and understand information by doing or applying something active) and verbal (written or spoken word explanations) spectra of the ILS space. The effects of active-reflective (S1) are consistently negative, indicating that quantitative performance is inversely correlated with this ILS measure. That is, more active users (negative scale of the active-reflective axis) seem to do better on their qualitative examinations. The post-survey and the satisfaction survey also showed significant effects on predicting the students’ quantitative performance in Stats 13.2.
Figure 4 shows the results of the ILS assessment of the Stats 13.2 (Fall’06, Christou) SOCR-treatment section. These graphs represent the histograms for each of the 4 ILS categories. As with the first study (Stats 13.1), there appears to be evidence suggesting the majority of the SOCR treatment group students were more reflective, intuitive, verbal and sequential, rather than active, sensing, visual and global. Again, as the ILS data was collected in the beginning of classes, these results do not reflect the experience of the (treatment group) students during the quarter. We observed significant evidence demonstrating the presence of positive (uni-directional) S1, S2, S3 and S4 effects (p-values < 0.001).
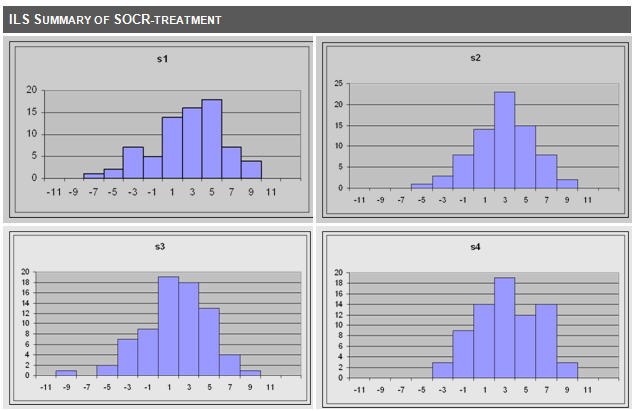
Figure 4: Histogram plots of the 4-dimensional ILS responses for the Stats 13.2 treatment group (Fall’06).
Statistics 100A class . Introduction to Probability Theory (Stats 100A) is the first course in a three-course sequence. The other two are Introduction to Mathematical Statistics and Regression Analysis. Most enrolled students are from Mathematics, Economics, and Computer Science majors. A description of the course can be found at http://courses.stat.ucla.edu/index.php?term=05f&lecture=26330320. The class meets 3 times a week with the instructor and once a week for a discussion with a teaching assistant.
Majority of the students enrolled in Statistics 100A were senior mathematics majors. Table 15 shows the student demographics for the control (Winter 2006) and SOCR-treatment (Fall 2006) classes. In this study, there were no significant differences between the treatment and control groups in the students’ seniority-rankings or the majors distributions.
Table 15: Stats 100A student demographics. The values in table represent the enrollment in the control (Fall 2005) and SOCR-treatment (Fall 2006) classes. |
|
Freshmen |
Sophomores |
Juniors |
Seniors |
Graduate |
Total |
Math |
0 (0) |
1 (0) |
12 (12) |
19 (22) |
0 (0) |
32 (34) |
Humanities |
0 (0) |
0 (0) |
0 (0) |
0 (1) |
0 (0) |
0 (1) |
Statistics |
0 (0) |
0 (0) |
1 (0) |
4 (3) |
0 (0) |
5 (3) |
BioStatistics |
0 (0) |
0 (0) |
0 (0) |
0 (0) |
1 (3) |
1 (3) |
Biology |
0 (0) |
0 (1) |
0 (0) |
0 (2) |
0 (0) |
0 (3) |
Others |
0 (0) |
1 (0) |
1 (0) |
8 (0) |
0 (0) |
10 (0) |
Total |
0 (0) |
2 (1) |
14 (12) |
31 (28) |
1 (3) |
48 (44) |
|
The final grade for the treatment group was computed based on three categories: homework, labs, and exams. The six homeworks accounted for 10% of the final grade and the five labs for another 10% of the final grade. There were five exams of which the first four were worth 15% each and the last was worth 20% of the final grade. The final grade for the control group was computed based on 2 categories – homeworks and exams. The homeworks accounted for 10% of the grade, and of the five exams three were worth 20% and the other two were worth 15%.
Two classes of Statistics 100A (Fall 2005 and Fall 2006) served as control and treatment groups, respectively. Both classes received three one-hour lectures per week plus one hour discussion time per week. The control group was not exposed to any of the SOCR tools or materials. The lectures of the treatment group integrated SOCR simulations, demonstrations and activities with the standard curriculum. In addition, the students of the treatment group were assigned SOCR labs, whereas students from the control group did not do assigned labs. Besides these differences, everything else was kept the same for both groups.
Tables 16, 17, 18, and 19 contain the results of the background knowledge quiz, the pre vs. post attitude surveys, and the satisfaction survey for Stats 100A. Like in study 2 (Stats 13.2), some of the questions in the attitude survey showed statistically significant differences in the mean student responses between the pre and post surveys (e.g., Q1, t-test p-value <0.001), Table 17. In this study we observed a more consistent trend of increase in the motivation and improved experiences in the treatment group (compared to unrelated other classes that did not use technology), Table 18 and Figure 5. The results of Part B of the final survey, Table 19, indicated some satisfaction with the use of SOCR materials and activities in the curriculum.
Table 16: Results of the background knowledge quiz (see Box 1). Left side shows seven standard summary statistics, and the right side illustrates a histogram plot of all scores . |
Statistics |
Value |
Mean |
8.197 |
SD |
1.212 |
min |
4 |
Max |
10 |
Q 1 |
8 |
Q 2 |
8 |
Q 3 |
9 |
|
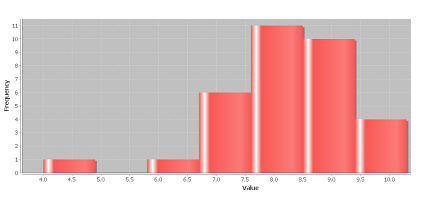 |
Table 17: Results of the Pre vs. Post attitude surveys (see Box 2). |
Question |
PRE |
POST |
Mean |
Median |
SD |
Mean |
Median |
SD |
Q1 |
5.05882 |
5 |
1.34707 |
6.26471 |
6 |
0.75111 |
Q2 |
1.88235 |
2 |
1.14851 |
1.47058 |
1 |
0.70647 |
Q3 |
4.85294 |
5 |
1.35137 |
4.91176 |
5 |
1.54464 |
Q4 |
4.05882 |
4 |
0.98292 |
4.14705 |
4 |
1.28233 |
Q5 |
5.44117 |
6 |
1.37491 |
5.79411 |
6 |
1.297536 |
Q6 |
2.35294 |
2 |
1.36808 |
2.64705 |
2 |
1.72121 |
Q7 |
2.05882 |
2 |
1.042757 |
1.76470 |
1 |
1.10258 |
Q8 |
4.35294 |
4 |
1.53509 |
4.97058 |
5 |
1.44568 |
Q9 |
2.70588 |
2.5 |
1.50814 |
1.82352 |
1 |
1.16698 |
Q10 |
3.411764 |
3 |
1.23381 |
4.11764 |
4 |
1.80512 |
|
Table 18: Part A results of the satisfaction survey
(see Box 3). |
Table 19: Part B results of the satisfaction survey
(see Box 3). |
PART A |
Questions |
HIGHER |
SAME |
LOWER |
a |
33, (97%) |
1, (3%) |
0, (0%) |
b |
20, (59%) |
12, (35%) |
1, (3%) |
c |
22, (65%) |
11, (32%) |
1, (3%) |
d |
22, (65%) |
11, (32%) |
1, (3%) |
e |
10, (29%) |
19, (56%) |
0, (0%) |
f |
10, (29%) |
23, (68%) |
0, (0%) |
g |
7, (21%) |
24, (71%) |
1, (3%) |
h |
31, (91%) |
3, (9%) |
0, (0%) |
i |
23, (68%) |
10, (29%) |
0, (0%) |
j |
19, (56%) |
14, (41%) |
1, (3%) |
k |
23, (68%) |
11, (32%) |
0, (0%) |
|
PART B |
1 |
More interesting |
33, (97%) |
Less interesting |
1, (3%) |
2 |
Harder |
9, (26%) |
Easier |
25, (74%) |
3 |
More |
33, (97%) |
Less |
1, (3%) |
4 |
Helped understand the world |
32, (94%) |
Does not help understand the world |
2, (6%) |
5 |
Will take another applied statistics class |
34, (100%) |
Will NOT take another applied statistics class |
0, (0%) |
|
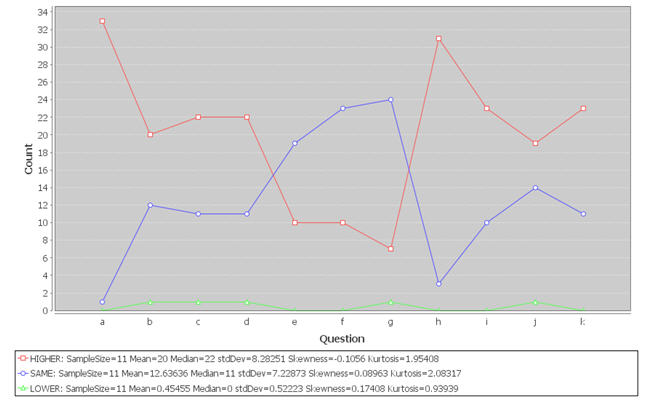
Figure 5: Plot of the end-of-quarter satisfaction survey frequencies of responses to the 11 questions
(see Box 3 and Table 19).
In this study, the quantitative score comparison between the treatment and control groups show encouraging results. We compared the SOCR-treatment and control classes using two sample t-tests, Table 20. Both of the Stats 100A courses (control and treatment) used the same grading style (exams and homework) and therefore are comparable.
Table 20: Quantitative Results measuring student learning in the two Stats 100A classes
(control, Fall 2005, and treatment, Fall 2006). |
|
Group |
High |
Low |
Median |
Mean |
Std Dev |
Statistics |
Exam 1 |
Control |
96 |
33 |
68 |
69.97 |
18.52 |
to = 0.99 t(71)
p=0.17 |
Treatment |
97 |
33 |
60 |
65.74 |
18.05 |
Exam 2 |
Control |
100 |
40 |
88 |
83.85 |
14.93 |
to = 0.81 t(71)
p=0.21 |
Treatment |
100 |
41 |
86 |
81.10 |
14.12 |
Exam 3 |
Control |
100 |
32 |
71 |
71.12 |
16.75 |
to=-3.87 t(71)
p=0.0001 |
Treatment |
100 |
58 |
87 |
83.64 |
10.58 |
Exam 4 |
Control |
100 |
36 |
79 |
78.35 |
16.56 |
to=-3.20 t(71)
p= 0.001 |
Treatment |
100 |
65 |
90 |
88.05 |
8.61 |
Exam 5 |
Control |
100 |
40 |
81 |
80.38 |
15.17 |
to=-2.46 t(71)
p=0.008 |
Treatment |
100 |
66 |
89 |
87.44 |
8.90 |
Overall Performance |
Control |
94.3 |
44.93 |
78.14 |
78.36 |
12.87 |
to=-2.16
t(71)
p=0.017 |
Treatment |
98.77 |
66.59 |
85.92 |
83.69 |
7.91 |
|
Figure 6 shows the results of the ILS assessment of the Stats 100A (Fall’06) SOCR-treatment section. These graphs represent the histograms for each of the 4 ILS categories. The same trend noticed in the 2 Stats 13 studies is observed here, although the shapes of the distributions are somewhat different. The majority of the SOCR treatment group students were again more reflective, intuitive, verbal and sequential, rather than active, sensing, visual and global. As in the previous 2 studies, we observed significant, albeit slightly weaker, evidence demonstrating the presence of positive (uni-directional) S1, S2, S3 and S4 effects (p-values < 0.003).
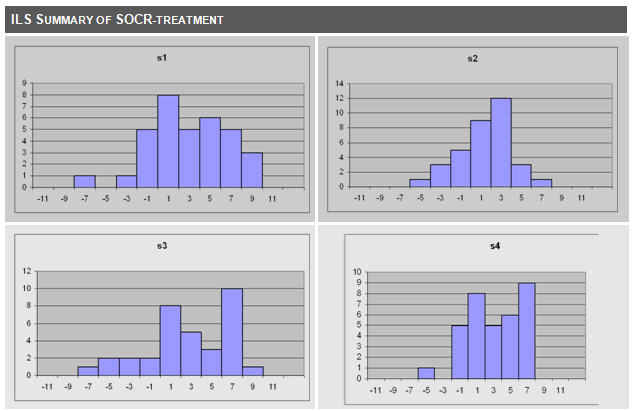
Figure 6: Histogram plots of the 4-dimensional ILS responses for the Stats 100A treatment group (Fall’06).
We explored the overall students’ performance with some independent variables (the four categories S1, S2, S3, S4, and students’ attitudes towards the field of probability and statistics). The results of the (quantitative) performance regression on ILS, pre and post attitudes and satisfaction (see Methods) are shown on Table 21. None of these variables represented significant predictors of the students’ quantitative performance in Stats 100A.
Table 21: Regression results for the ILS effects on overall quantitative performance for the Stats 100A (Christou). |
Source |
SS |
df |
MS |
Number of obs = 33
F( 8, 24) = 0.55
Prob > F = 0.8070
R-squared = 0.1550
Adj R-squared = -0.1267
Root MSE = 10.479
|
Model |
483.3287 |
8 |
60.4160 |
Residual |
2635.177 |
24 |
109.799 |
Total |
3118.506 |
32 |
97.4533 |
Total |
Coefficient |
Std Err |
T |
P>| t | |
|
[95% Conf. Interval] |
s1 |
-0.00776 |
0.61196 |
-0.01 |
0.99 |
-1.2708 |
1.25527 |
s2 |
-0.58535 |
0.86098 |
-0.68 |
0.503 |
-2.3623 |
1.1916 |
s3 |
-0.16777 |
0.50167 |
-0.33 |
0.741 |
-1.2031 |
0.86762 |
s4 |
0.44215 |
0.78431 |
0.56 |
0.578 |
-1.1765 |
2.0608 |
pre |
-0.06491 |
0.59874 |
-0.11 |
0.915 |
-1.3006 |
1.1708 |
post |
-0.54848 |
0.5296 |
-1.04 |
0.311 |
-1.6415 |
0.5445 |
sat |
-0.82272 |
0.64529 |
-1.27 |
0.215 |
-2.1545 |
0.5091 |
quiz |
0.73723 |
1.7018 |
0.43 |
0.669 |
-2.7751 |
4.2495 |
_const |
113.7103 |
31.53091 |
3.61 |
0.001 |
48.633 |
178.78 |
|
General trends and analysis of results . Quantitative measurements in all three classes (two Stat 13 and one Stat 100A) showed that the treatment groups consistently outperformed the control groups. This was clear by the overall class performance, which includes all homework, labs, and exams (see Tables 6, 13, and 20). Undoubtedly, this illustrates that SOCR significantly affected students’ performance for these three introductory Statistics classes at UCLA. We also received positive feedbacks from all three classes on the use of SOCR. As shown from the result of the end-of-quarter satisfaction survey, the majority of students indicated that technology helped them understand the main concepts of the course (see Tables 4, 11, and 18, question a).
Especially for Stat 100A, which mostly includes students from Mathematical Sciences, we see an overall positive trend in their satisfaction survey. As seen in Table 19, 97% of students indicated that SOCR made the class more interesting and 74% said SOCR made the class easier. This result demonstrates that SOCR has effects on students in the Mathematical Sciences field, and suggests that SOCR-embedded mathematics curricula improve student attitudes towards the class. Mathematics classes rarely include sections with hands-on processing and/or data exploration, like the SOCR tools and activities we used in our study. Our results illustrate that introduction of such pedagogical approaches in mathematics-oriented courses may improve motivation and enhance students’ learning experiences.
In this study, we did not investigate the possible instructor-effects or the effects of the style of blending IT in the curriculum. The way in which instructors use technology in their courses can greatly affect students’ experiences in the courses, and the outcome results may vary significantly based on the specific pedagogical utilization of technology. Future research studies should investigate more closely the effects of concrete implementations and use of technology in the classroom.
In this study, SOCR exposure in the treatment group included lecture and lab discussions; however the most striking differences between the treatment and control groups were the diametrically opposed laboratory sections. Thus, the magnitude of the observed differences between SOCR-treatment and control groups may have been in large aspects due to the laboratory sections conducted by teaching assistants. Laboratory assignments were written separately by each teaching assistant for their particular class. This could be another factor explaining differences in the findings between the two Statistics 13 courses (Dinov’s and Christou’s sections).
Table 22 depicts a summary of this meta-study. The columns in Table 22 show the data we had acquired for each of the 3 studies. Each row in this table contains references to appropriate figures and tables in the paper, and includes a brief annotation of the effect of this variable to discriminate the control and treatment groups or to predict the final quantitative outcomes (overall grades), as applicable. Notations: SSBGD= some significant between group differences (treatment vs. control), NSBGD= no significant between group differences, SUDE=significant uni-directional effects of the S1, S2, S3 & S4 ILS dimensions, NSPPD=no significant Pre vs. Post attitude differences (in treatment groups).
Table 22. Summary of our study-design and research-findings on the effects of learning styles, attitudes and technology-enhanced education in probability and statistics courses (see text). |
Study |
Demographics |
Background |
ILS |
Exams |
Pre & Post Attitude
|
Satisfaction |
Regression |
Stats 13.1 |
References |
Table 1 |
Table 2 |
Fig. 1 |
Table 6 |
Table 3 |
Tables 4 & 5 |
Table 7 |
Results |
SSBGD |
SSBGD |
SUDE |
SSBGD |
NSPPD |
Trend (A)
No Trend (B)
|
Only
Pre-attitude |
Stats 13.2 |
References |
Table 8 |
Table 9 |
Fig. 3 |
Table 13 |
Table 10 |
Tables 11 & 12, Figure 2 |
Table 14 |
Results |
SSBGD |
NSBGD |
SUDE |
SSBGD |
Trend but NSPPD |
Trend (A)
No Trend (B)
|
S1+S3+Post |
Stats 100A |
References |
Table 15 |
Table 16 |
Fig. 4 |
Table 20 |
Table 17 |
Tables18 & 19 |
Table 21 |
Results |
NSBGD |
NSBGD |
SUDE |
SSBGD |
Trend but NSPPD |
Trends |
None |
|
Discussion
Novel communication and information technology tools provide the foundation for efficient, timely, interactive and graphical demonstrations of various scientific concepts in and out of the classroom. Now-a-days it is possible to conduct a complete investigative study using a web-browser and various interoperable tools for data collection, processing, visualization, analysis and interpretation. The SOCR resources provide a framework, where learners can use mouse clicks, copy and paste actions, and interactive web-based functions to go from data generation to data analysis and understanding within seconds, without demanding any special software, user-authentication or advanced hardware infrastructure.
Here, we reported on a meta-study of 3 controlled experiments of using SOCR resources vs. traditional pedagogical approaches. Qualitative and quantitative data we collected from all courses included Felder-Silverman-Soloman index of learning styles, quantitative background assessment, pre and post surveys of attitude towards the subject, end-point satisfaction survey, and varieties of examination, quiz and laboratory test scores. This study confirms the findings and significantly extends a previous report on the technology-driven improvement of the quantitative performance in probability and statistics courses (Dinov et al., 2008) . The results of the 10 pre- or post survey questions were not consistent between the 3 different classes (Cronbach's a = -0.4495 ).
Students’ learning styles and attitudes towards a discipline are important confounds of their final quantitative performance. We identified a marginal (within each study), yet very consistent (across all studies) effect of SOCR-treatment, which tends to increase student satisfaction (measured by post surveys) and improve quantitative performance (measured by standard assessment instruments). These observed positive effects of integrating information technology with established pedagogical techniques may also be valid across STEM disciplines (Dinov, 2008; Dinov et al., 2008) . The two critical components of improving science education via blended instruction include instructor-training and the development of appropriate curriculum- and audience-specific activities, simulations and interactive resources for data understanding. The beginning quiz taken by the treatment groups at the start of the courses was used to inform instructors about the students’ level of understanding of basic concepts of probability and statistics. These results help instructors design activities specific to students’ learning needs.
Simulations and virtual experiments provide powerful instructional tools that complement classical pedagogical approaches. Such tools are valuable in explaining difficult statistical concepts in probability and statistics classes. Utilizing visualization, graphical and computational simulation tools in teaching provides valuable complementary means of presenting concepts, properties and/or abstract ideas. In addition, such IT-based pedagogical instruments are appreciated and well received by students who normally operate in technological environments far exceeding these of their instructors. In our experiments, we saw effects of using SOCR simulation tools even when we did not completely stratify the student populations or control for all possible predictors (like age, major, learning style, background, attitude towards the subject, etc.) The effects we saw within each class provide marginal cues favoring technology-enhanced blended instruction. However, the results were very robust across all 3 studies and support other independent investigations (Dinov et al., 2008; Kreijns et al., 2007) . Our findings show that the students’ learning styles can play important roles in their quantitative performance. Despite that, we would not blindly recommend that instructors employ technology-enhanced approaches to improve learning outcomes solely based on students’ learning styles. There are advantages to broad spectrum training outside the domain of the students’ preferred learning approach. For example, in multidisciplinary studies, active, visual or global learners may significantly benefit from exposure to reflective, verbal and/or sequential pedagogical styles.
Acknowledgements
This work was funded in part by NSF DUE grants 0716055 & 0442992, under the CCLI mechanism, and NIH Roadmap for Medical Research, NCBC Grant U54 RR021813. The SOCR resource is designed, developed and maintained by faculty and graduate students in the departments of Statistics, Computer Science, Laboratory of Neuro Imaging, Neurology and Biomedical Engineering at UCLA. All data-analyses and result-visualization was accomplished using SOCR Analyses, Modeler and Charts (http://www.SOCR.ucla.edu).
The help of our teaching assistants (Christopher Barr, Jackie Dacosta, Brandi Shantana and Judy Kong) was invaluable in the process of conducting this SOCR evaluation. We are also indebted to Juana Sanchez for her valuable feedback, PhuongThao Dinh for her insightful remarks, and Maykel Vosoughiazad for his help with the data processing. The authors are also indebted to the JOLT editors and reviewers for their constructive critiques and valuable recommendations.
|
References
Ali A. (2008) Modern technology and mass education: a case study of a global virtual learning system, in: A. Edmundson (Ed.), Globalized learning cultural challenges, Idea Group, Hershey. pp. 327-339.
ARTIST. (2008) https://app.gen.umn.edu/artist
BlackBoard. (2008) http://www.blackboard.com.
Blasi L., Alfonso B. (2006) Increasing the transfer of simulation technology from R&D into school settings: An approach to evaluation from overarching vision to individual artifact in education. Simulation Gaming 37:245-267. DOI: 10.1177/1046878105284449.
Cassidy S. (2004) Learning styles: an overview of theories, models and measures. Educ. Psychol. 24:419-444.
Che A., Cui J., Dinov I. (2009a) SOCR Analyses – an Instructional Java Web-based Statistical Analysis Toolkit. JOLT 5:1-19.
Che A., Cui J., Dinov I. (2009b) SOCR Analyses: Implementation and Demonstration of a New Graphical Statistics Educational Toolkit. JSS 30:1-19.
Dinov I. (2006) Statistics Online Computational Resource. Journal of Statistical Software 16:1-16.
Dinov I. (2008) Integrated Multidisciplinary and Technology-Enhanced Science Education: The Next Frontier. JOLT 4:84-93.
Dinov I., Christou N. (2009) Statistics Online Computational Resource for Education. Teaching Statistics 31:49-51.
Dinov I., Sanchez J., Christou N. (2008) Pedagogical Utilization and Assessment of the Statistics Online Computational Resource in Introductory Probability and Statistics Courses. Journal of Computers & Education 50:284–300. DOI: http://doi:10.1016/j.compedu.2006.06.003.
EduBlogs. (2008) http://oedb.org/library/features/top-100-education-blogs.
Felder R.M., Silverman, L.K. (1998) Learning and teaching styles in engineering education. Engineering Education 78:674-681.
Felder R.M., Soloman, B. A. (2003) Index of learning styles questionnaire. http://www.engr.ncsu.edu/learningstyles/ilsweb.html.
Ho A.J., Stein J.L., Hua X., Lee S., Hibar D.P., Leow A.D., Dinov I.D., Toga A.W., Saykin A.J., Shen L., Foroud T., Pankratz N., Huentelman M.J., Craig D.W., Gerber J.D., Allen A.N., Corneveaux J.J., Stephan D.A., DeCarli C.S., DeChairo B.M., Potkin S.G., Jack C.R., Weiner M.W., Raji C.A., Lopez O.L., Becker J.T., Carmichael O.T., Thompson P.M. (2010) A commonly carried allele of the obesity-related FTO gene is associated with reduced brain volume in the healthy elderly. Proceedings of the National Academy of Sciences 107:8404-8409. DOI: 10.1073/pnas.0910878107.
Honey P., Mumford A. (1982) The manual of learning styles Peter Honey.
Knowles E., Smith M. (2005) Boys and literacy: practical strategies for librarians, teachers, and parents Libraries Unlimited.
Kreijns K., Kirschner P.A., Jochems W., van Buuren H. (2007) Measuring perceived sociability of computer-supported collaborative learning environments. Computers & Education 49:176-192.
LPB. (2008) http://www.lpb.org/education/.
MathNetTestBank. (2008) http://db.math.umd.edu/testbank/.
Meletiou-Mavrotheris M., Lee C., Fouladi R.T. (2007) Introductory statistics, college student attitudes and knowledge a a qualitative analysis of the impact of technology-based instruction. International Journal of Mathematical Education in Science and Technology 38:65-83.
Moodle. (2008) http://moodle.stat.ucla.edu/.
Orlich D., Harder R., Callahan R., Trevisan M., Brown A. (2009) Teaching Strategies: A Guide to Effective Instruction Cengage Learning.
SAKAI. (2008) http://sakaiproject.org/.
Santos H., Santana L., Martins D., De Souza W., do Prado A., Biajiz M. (2008) A ubiquitous computing environment for medical education, Proceedings of the 2008 ACM symposium on Applied computing, ACM, Fortaleza, Ceara, Brazil.
Schochet P.Z. (2008) Statistical Power for Random Assignment Evaluations of Education Programs. Journal of Educational and Behavioral Statistics 33:62-87. DOI: 10.3102/1076998607302714.
Sims S. (1995) (Ed.)^(Eds.) The importance of learning styles: understanding the implications for learning, course design, and education, Greenwood Publishing Group. pp. Pages.
SOCRWiki. (2008) http://wiki.stat.ucla.edu/socr/.
Sowell E.R., Leow A.D., Bookheimer S.Y., Smith L.M., O'Connor M.J., Kan E., Rosso C., Houston S., Dinov I.D., Thompson P.M. (2010) Differentiating Prenatal Exposure to Methamphetamine and Alcohol versus Alcohol and Not Methamphetamine using Tensor-Based Brain Morphometry and Discriminant Analysis. J. Neurosci. 30:3876-3885. DOI: 10.1523/jneurosci.4967-09.2010.
STATA. (2008) http://www.stata.com/.
TechEdBlogs. (2008) http://kathyschrock.net/edtechblogs.htm.
UCLAX. (2008) http://www.UclaExtension.edu/.
VARK. (2008) http://www.vark-learn.com/.
VOH. (2008) http://voh.chem.ucla.edu/.
WebWork. (2008) http://webwork.maa.org/moodle/.
WikiBooks. (2008) http://www.WikiBooks.org/.
YouTube. (2008) https://www.YouTube.com.
|
|
|
|
|
|
|