Learning Equity between Online and On-Site Mathematics Courses
|
Sherry J. Jones
Professor
Department of Business
Glenville State College
Glenville, WV 26351 USA
sherry.jones@glenville.edu
Vena M. Long
Professor Emerita of Mathematics Education
Department of Theory and Practice in Teacher Education
The University of Tennessee at Knoxville
Knoxville, TN 37998 USA
vlong@utk.edu
Abstract
This paper reports on a research study that focused on equity in learning as reflected in the final grades of online and on-site students from the same post-secondary mathematics course taught repeatedly over 10 semesters from Fall 2005 through Spring 2011. On-site students attended regular class sessions, while online students only attended an orientation session and a final exam. Mean final course grades for all online and on-site students were compared statistically to see if there was a significant difference in learning. The findings revealed significant differences in online and on-site students' final grades, in favor of on-site student achievement. Statistical tests were also conducted on a number of subsets drawn from all students' final grades in order to search for any underlying nuances that might exist. When the first three semesters of data were removed from the dataset, no significant difference was found between the mean scores for on-site and online students for the seven most recent semesters. It is reasonable to conclude that it is possible for students in both on-site and online sections of a course to achieve equity in mathematics learning as measured by final course grades.
Keywords: achievement, final grades, online vs. face-to-face, difference in learning, equity in learning, post-secondary mathematics education |
Introduction
The phenomenal growth of technology is having a significant impact on the ways teachers teach and students learn mathematics. As a direct result of the growth in technological capability, mathematics courses are being taught online in order to meet increased student needs for online learning opportunities. A logical question that arises from online mathematics course offerings is whether student achievement in online mathematics courses is equitable to achievement in on-site mathematics courses. This research examines achievement in an online versus a traditional classroom-based mathematics post-secondary course taught repeatedly over 10 semesters. With the increased emphasis on accountability for teaching and learning, the question of equity in achievement between online and on-site mathematics learning must be answered. Online courses certainly have the potential to create equity of access to education for some students. The question remaining is whether or not equity of learning can be created as well.
Equity in learning for students in online and on-site mathematics courses is a worthy goal for institutions desiring quality course offerings for all students. Documenting and analyzing any significant differences in achievement between online and on-site mathematics students will help institutions address learning equity issues. The answers to the research questions in this study contribute important information to an education institution's decision-making processes and to mathematics educators as they facilitate learning.
Literature Review
Research regarding online versus on-site learning in post-secondary education has increased in recent years, but research findings on achievement in online versus on-site mathematics courses have been scarce. An interesting study by Ryan (2001) compared learning experiences in a classroom-based instructional method with two distance education systems. In that study, three options were available for students to take an introduction to statistics course: a web-based course, a video-based telecourse, or a classroom-based course. The results showed no significant difference in the final course grades in the distance learning courses as compared with students' performance in the traditional classroom.
A more recent study concluded that "developmental mathematics students who were enrolled in the online courses had higher success rates than the students enrolled in the traditional lectures" (Lynch-Newberg, 2010, p. 1). Another study indicated "it seems that the quality of education gained from online basic skills mathematics courses is relatively equivalent to face-to-face courses" (Rey, 2010, pp. viii-ix). A third study regarding the effectiveness of introductory English and mathematics online college courses found a robust negative impact of taking online courses in English and mathematics (Xu & Jaggars, 2011). Finally, Eggert's (2009) comparison study of online versus classroom-based developmental mathematics showed "no statistically significant difference in the successful course completion means of the two instructional delivery systems" (p. ii).
Another comparison study of developmental math student success in an online, blended, and face-to-face learning environment contradicted previous research findings of there being no significant difference in success based on learning environment. Students in the blended environment had the least success in the course, while face-to-face students performed poorly when compared to online students (Ashby, Sadera, & McNary, 2011). Thus, four out of five of the 2009-2011 research studies indicate either equivalent or improved effectiveness of online mathematics course success rates.
This research study focused on whether there was equivalent learning between on-site and online students in the same course over a period of several semesters. The underpinning of the research is based on Equivalency Theory. The premise of Equivalency Theory (Simonson, Schlosser, & Hanson, 1999) is the idea that the more equivalent the learning experiences of distant learners and local learners, the more equivalent the educational outcomes will be for all learners. Equivalent learning experiences may be different for each student, tailored to the student's environment and situation:
Just as a triangle and a square may have the same area and be considered equivalent even though they are different geometrical shapes, the experiences of the local learner and the distant learner should have equivalent value even though these experiences might be very different. (Simonson et al., 1999, p. 7)
Different students in various locations may require a different mix of learning experiences, but the sum of the experiences for each learner should be equivalent in value. Equivalency Theory also connects closely with the Equity Principle from the National Council of Teachers of Mathematics (NCTM) Principles and Standards for School Mathematics (2000): "Excellence in mathematics education requires equity – high expectation and strong support for all students" (p. 12). NCTM also maintains that every student may not receive identical instruction, but instructional programs should help students see the utility of continued mathematical study for their own futures. An equitable mathematics program will provide solid support for learning in response to students' prior knowledge, intellectual strength, and personal interests. "Well-documented examples demonstrate that all children, including those who have been traditionally underserved, can learn mathematics when they have access to high-quality instructional programs that support their learning" (NCTM, 2000, p. 14).
Few quantitative studies have been carried out that are able to shed light on achievement and equivalent learning in online as compared to on-site mathematics courses. This study helps populate the research literature with a quantitative study of achievement in a mathematics course offered in an online format compared to an on-site format.
The Problem Statement
In order to determine if there is a significant difference in mathematics learning between students who complete a mathematics course in an on-site format and students who complete the same mathematics course in an online format, the following two research questions were formulated:
- Is there equity in learning between online and on-site students completing the same mathematics course?
- Is there equity in learning between online and on-site students successfully completing the same mathematics course?
Equity of learning between students was defined as learning that is equivalent in value. Learning was measured by final course grades. Successful completion of the course was indicated by a grade of 70% (C) or higher.
This research study rests on the following assumptions made by the researchers:
- The final grade in the course is an accurate reflection of student achievement;
- Each student's final grade reflects his/her own work effort;
- Each student made an effort to succeed in the course;
- Each student chose the course format that he/she perceived best met his/her needs.
Research Setting
Final course grades from a mathematics course taught at a small, open-enrollment rural Appalachian college were gathered for 10 semesters. The course is titled Quantitative Business Analysis I (QBA I) and is similar to a business mathematics course. Each semester, one section of the course was offered in an online format and the other section was offered in an on-site format. The course is required for all majors in the college's Business Department and is used as an elective course by other departments. All business majors, whether a two-year or four-year degree candidate, are required to complete the course with a grade of 70% (C) or higher. Most business students take the course during their freshman year.
The content of the course begins with a review of the basic operations of whole numbers, fractions, and decimals. Other content topics include working with percentages and ratios, calculating cash and trade discounts, depreciation, inventory values, taxes, insurance premiums, payroll, simple interest, compound interest, and investment proceeds. There is no required prerequisite for the course; however, if a student needs developmental mathematics courses upon entering college, it is recommended that at least one developmental mathematics course be completed before attempting QBA I.
Procedures
Learning for students who completed either the online or on-site class was measured by the final course grade. Grades from 10 semesters from Fall 2005 to Spring 2011 were collected for both online and on-site sections of QBA I. Each online and on-site student's final percentage course average was entered (without student names) into the Statistical Package for the Social Sciences (SPSS) software. Once the overall online class mean and overall on-site class mean were computed, they were compared to determine if they were significantly different.
The following null hypothesis was tested:
 (There is no statistically significant difference in mean achievement between online and on-site students completing the same mathematics course.)
Basic descriptive statistics were calculated for each class section. Tests for normality indicated whether it was appropriate to assume a normal distribution of data for each class. Boxplots indicated the shape of the distribution and any outliers in the data groups. A quantile–quantile (QQ) probability plot helped determine whether normality held for the data. The normality of the data (or lack thereof) determined the appropriate statistical tests for comparison of the online class final grade mean with the on-site class final grade mean. If the data were not normally distributed, the Mann–Whitney U test was used to test the null hypothesis. The t-test for independent samples was used to test for statistical significance for data that can be considered normally distributed.
Quantitative Analysis
Final course grade data were analyzed using the features of SPSS version 16. All hypotheses were evaluated at the .05 level of significance.
Student learning was defined as achievement in the course as measured by final course grades, so descriptive statistics (see Table 1) were generated for final course grades in each of the two sections of the QBA I course.
Table 1. Final course grade descriptive statistics
Class Section |
N |
|
|
|
|
|
|
On-site |
267 |
78.655 |
81.200 |
16.271 |
6.5 |
108.5 |
17.6 |
On-site |
178 |
73.646 |
76.200 |
14.254 |
24.0 |
101.7 |
15.0 |
These descriptive statistics and observations are represented visually in the boxplots in Figure 1. Several low grades were present in both the on-site and online sections of the course.
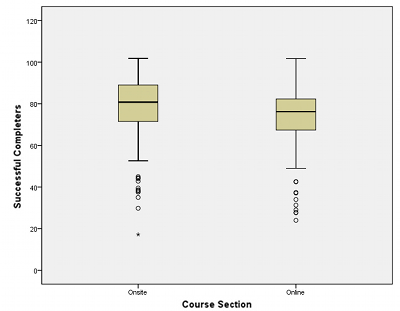
Figure 1. Final course grade boxplots
Histograms (Figures 2 and 3) and QQ plots (Figures 4 and 5) of the two datasets indicate there are some values, particularly lower grades, that are different from the majority of grades in the datasets. Both datasets exhibit a negative skew. While normality of the dataset is in question, each dataset contains more than 100 data items.
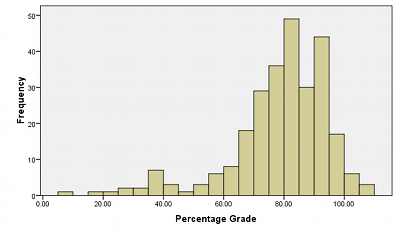
Figure 2. Final on-site course grade histogram (N = 267)
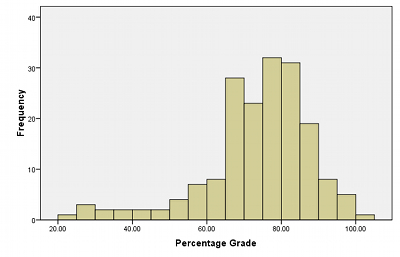
Figure 3. Final online course grade histogram (N = 178)
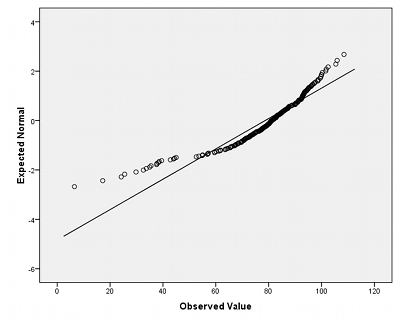
Figure 4. Final on-site course grades QQ plot (N = 267)
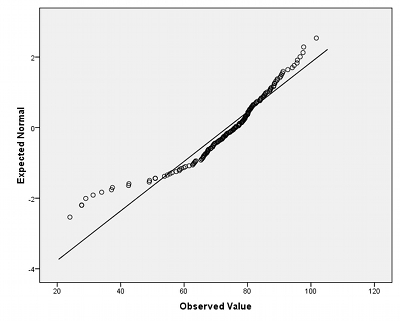
Figure 5. Final online course grades QQ plot (N = 178)
Levene's test for homogeneity of variance indicated that the variance in the on-site class final grades was not significantly different from the variance in the online class final grades, F(1, 443) = 1.308, ns at .253. Using the Shapiro–Wilk test for normality of the data, however, both the on-site and online final grade datasets appeared to be significantly non-normal. In the on-site class data, W(267) = .892, p = .000; in the online class data, W(178) = .918, p = .000. Therefore, the Mann–Whitney U non-parametric test was utilized to test the following hypothesis:
 (There is no statistically significant difference in mean achievement between online and on-site students completing the same mathematics course.)
The comparison of mean course percentage grades in the two sections of the course resulted in a significant difference between the mean percentage course grade in the online class and the mean percentage course grade in the on-site class. Output from the Mann–Whitney U test indicated U = 17615.5, p = .000.
Since on-site and online datasets each contained over 100 data items, the t-test for independent samples was also applied to compare results. Once again, there was a significant difference in the mean scores for the two class sections, with t(443) = 3.341, p = .001.
These statistically significant results seem to indicate that on-site students must have learned more than the online students. Not only was the on-site student mean grade 5% higher than the online student mean grade, but also the median on-site grade was 5% higher than the median online grade. One might conjecture that the lecture and in-class work gave on-site students an advantage in learning the course material. Interestingly, however, the on-site student grade set had the lowest grade of the entire dataset, as well as the highest grade. The on-site students also had the largest number of outliers on the lower end of the grades, and a greater spread of grades in the middle 50% of the data. Outliers and greater spread of data in the on-site dataset pointed to the need for further investigation.
Next, extremes in each dataset were removed. Scores above 100% and scores below 50% were removed from both the on-site and online datasets (n = 242 in the on-site dataset; n = 165 in the online dataset) and tests for normality were repeated. The Shapiro–Wilk normality test still showed significant results for the on-site class data, W(242) = .978, p = .001; normality of this data was still in question, although improved. In the online class data, W(165) = .992, p = .440; the dataset was now normally shaped. Levene's test for homogeneity of variance indicated that the variance in the on-site class final grades was not significantly different from the variance in the online class final grades, F(1, 405) = .342, ns at .559. Both Mann–Whitney U and t-tests were repeated to compare the new means (on-site: 81.269; online: 76.217). Output from the Mann–Whitney U test indicated U = 14275.5, p = .000. Results from the t-test showed t(405) = 4.880, p = .000. The new tests continued to show a significant difference between on-site and online student achievement. Once again, it was confirmed that on-site students seemed to have learned more than the online students.
Further Analysis
A business student who completes QBA I must make a grade of 70% (C) or higher; otherwise, the student must repeat the course. For purposes of this study, a student who successfully completed QBA I was defined as a student who earned a final grade of 70% (C) or higher. Starting again with the original dataset, all grades below 70% were deleted from both the on-site and online class sections. Table 2 shows descriptive statistics generated from the adjusted datasets. There is a range of 38.5 in on-site student scores while there is a range of 31.5 in online student scores.
Table 2. Final course grade descriptive statistics for successful completers
Class Section |
N |
|
|
|
|
|
|
On-site |
214 |
84.897 |
84.100 |
8.457 |
70.0 |
108.5 |
13.22 |
On-site |
119 |
81.251 |
80.200 |
6.912 |
70.2 |
101.7 |
9.6 |
These descriptive statistics and observations are represented visually in the boxplots in Figure 6.
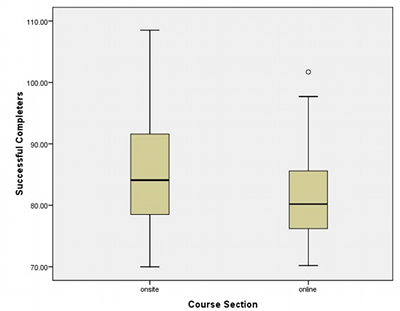
Figure 6. Successful completer final course grade boxplots
The histograms in Figures 7 and 8 and the QQ plots in Figures 9 and 10 indicate some movement toward normal distribution shapes for the two datasets. The Shapiro–Wilk test for normality of the data still yielded significant results, however, bringing into question the normality of the data once again. In the on-site class data, W(214) = .979, p = .003; in the online class data, W(119) = .963, p = .002. Since p < .05 in both cases, normality of the data is questionable.
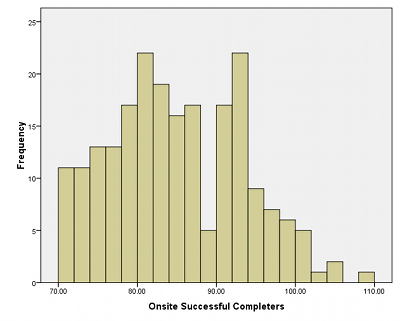
Figure 7. Final on-site course successful completer grade histogram (n = 214)
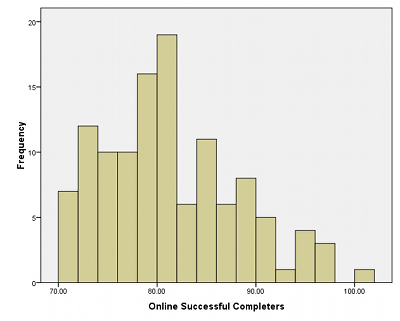
Figure 8. Final online course successful completer grade histogram (n = 119)
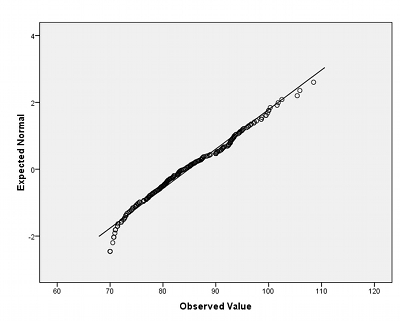
Figure 9. Final on-site course successful completer grades QQ plot (n = 214)
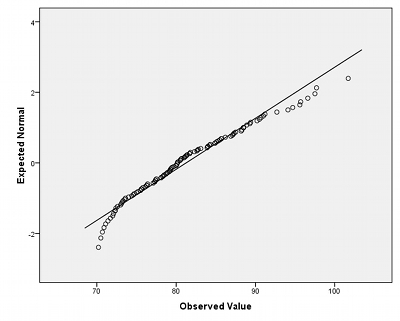
Figure 10. Final online course successful completer grades QQ plot (n = 119)
Further, Levene's test for homogeneity of variance indicated that the variance in the on-site class final grades was significantly different from the variance in the online class final grades, F(1, 331) = 8.962, s at .003.
The Mann–Whitney U test, followed by the t-test for independent samples, equal variances not assumed, was utilized to test the following hypothesis:
 (There is no statistically significant difference in mean achievement between online and on-site students who successfully complete the same mathematics course.)
A significant difference was found between the mean scores for successful online course completers and successful on-site course completers. The Mann–Whitney U test indicated U = 9486.5, p = .000. Results from the t-test showed t(286.318) = 4.251, p = .000.
Intermediate Summary
In summary, there is a significant difference between on-site and online course achievement as measured by final course percentage grades, in favor of on-site course student achievement over the course of the 10 semesters included in this study. There are a number of factors that must be considered, however, before one would rely too heavily on these conclusions. While the online course section was taught consistently by one instructor with nearly uniform expectations across all semesters, the on-site course section was taught over the time period of this study by four different instructors. All four of the on-site instructors had their own grading and assessment systems, which in several cases did not align closely with all the assessment mechanisms utilized in the online course section.
For example, an examination of syllabi for the on-site courses reveals that the number, frequency, and format of assessments were different for each of the on-site instructors. The instructor who taught the online sections and two of the 10 on-site sections in this study consistently used an algorithmically generated online assessment system for both the on-site and online students. None of the other three instructors utilized this online assessment system. In order to gain greater insight into possible assessment and grading difference among instructors, a semester-by-semester analysis of class averages was conducted.
Final Analysis
A semester-by-semester analysis revealed that only the first three semesters in this 10-semester time period showed a significant difference between the on-site and online student grades. Further investigation indicated that one instructor who was teaching the on-site section for the first three semesters may have been more generous with grading than the instructors teaching subsequent sections of the on-site class. The first three of the 10 semesters of this study also represented a time when students were just beginning to take online courses, which required some adjustment by students to this way of learning. Consequently, online student grades were lower than usual during these three semesters. Table 3 shows the percentage of total grades per section per semester that were A, B, or C grades (70% or higher).
Table 3. Percentage of A, B, or C grades (70% or higher)
Class Section |
Fall 2005
|
Spring 2006 |
Fall 2006 |
Spring 2007 |
Fall 2007 |
Spring 2008 |
Fall 2008 |
Spring 2009 |
Fall 2009 |
Spring 2011 |
On-site |
88.9 |
75.0 |
95.8 |
68.8 |
83.8 |
68.4 |
72.4 |
73.1 |
81.8 |
82.6 |
On-site |
|
57.9 |
60.0 |
73.3 |
76.2 |
87.5 |
68.4 |
73.7 |
60.0 |
76.9 |
Because of both the low percentage of grades that were 70% or higher in the online sections and the high percentage of grades of that were 70% or higher in the on-site sections during the first three semesters, the first three semesters were deleted from the original dataset and all statistics were generated again.
Table 4 shows descriptive statistics generated from the adjusted on-site and online datasets. There is a range of 38.5 in on-site student scores and a range of 31.5 in online student scores.
Table 4. Final course grade descriptive statistics for seven semesters
Class Section |
N |
|
|
|
|
|
|
On-site |
183 |
77.333 |
80.700 |
18.054 |
6.5 |
108.5 |
18.70 |
On-site |
118 |
76.131 |
78.850 |
13.392 |
24.0 |
101.7 |
14.80 |
These descriptive statistics and observations are represented visually in the boxplots in Figure 11.
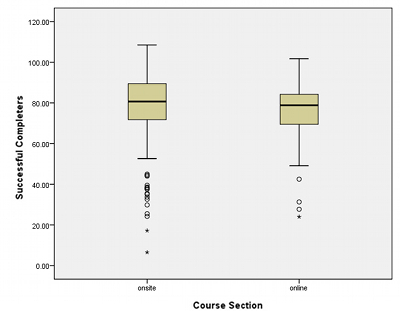
Figure 11. Seven-semester final course grade boxplots
The histograms in Figures 12 and 13 and the QQ plots in Figures 14 and 15 indicate some normal distribution concerns for the two datasets. Both datasets exhibit a negative skew. The Shapiro–Wilk test for normality of the data yielded significant results. In the on-site class data, W(183) = .889, p = .000; in the online class data, W(118) = .912, p = .000. Since p < .05 in both cases, normality of the data is questionable.
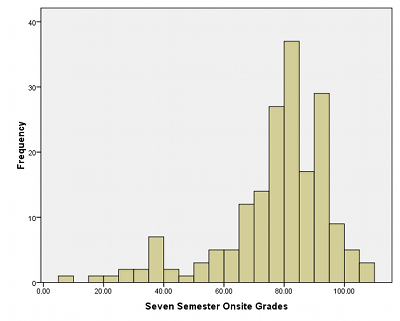
Figure 12. Final on-site course grade seven-semester histogram (n = 183)
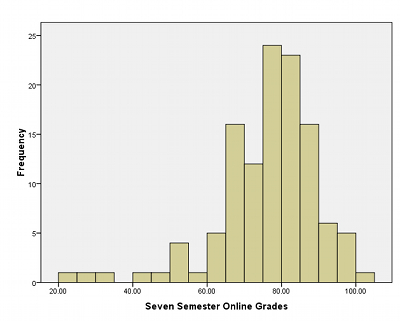
Figure 13. Final online course grade seven-semester histogram (n = 118)
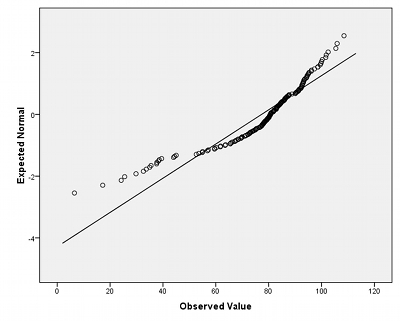
Figure 14. Final on-site course grade seven-semester QQ plot (n = 183)
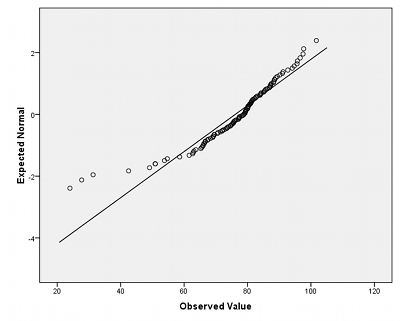
Figure 15. Final online course grade seven-semester QQ plot (n = 118)
Further, Levene's test for homogeneity of variance indicated that the variance in the on-site class final grades was significantly different from the variance in the online class final grades, F(1, 299) = 6.254, s at .013.
The Mann–Whitney U test, followed by the t-test for independent samples, equal variances not assumed, was utilized to test the following hypothesis:
 (There is no statistically significant difference in mean achievement between online and on-site students who complete the same mathematics course.)
No significant difference was found between the mean scores for on-site and online students for the seven-semester dataset. The Mann–Whitney U test indicated U = 9350.5, p = .000. Results from the t-test showed t(293.122) = .662, p = .508.
Conclusion
Online mathematics course offerings have increased so rapidly that it has been difficult for research to keep pace with this growth. Research in the area of online mathematics course offerings in rural areas, especially in Appalachia, has been nearly nonexistent. This research study makes an important contribution to addressing the question of equity between online and on-site mathematics learning and achievement. Mathematics stands as the gatekeeper to higher education and career choices. It is critical that students have access to quality mathematics courses. The findings of the study offer important information to higher education institutions seeking to offer quality online courses that meet the needs of their students and communities.
Since no significant difference was found between the mean scores for on-site and online students for the seven most recent semesters, it seems reasonable to conclude that it is possible for students in both on-site and online sections of a course to achieve equity in mathematics learning as measured by final course grades.
Future research is needed to further explore the impact on student learning of consistent curriculum and assessment when the same course is taught by multiple instructors, regardless of whether all sections of the course are on-site, online, or a mixture of both online and on-site. Student preferences of online versus on-site learning should also be explored to learn how students believe they learn best and what other factors may influence their decision to choose one format of the course over another.
References
Ashby, J., Sadera, W. A., & McNary, S. W. (2011). Comparing student success between developmental math courses offered online, blended, and face-to-face. Journal of Interactive Online Learning, 10(3), 128-140. Retrieved from http://www.ncolr.org/jiol/issues/pdf/10.3.2.pdf
Eggert, J. G. (2009). A comparison of online and classroom-based developmental math courses (Doctoral dissertation). Available from ProQuest Dissertations & Theses database. (UMI No. 3388207)
Lynch-Newberg, S. A. (2010). The retention, success, and progress rates of rural females in traditional lecture and online developmental mathematics courses (Doctoral dissertation). Available from ProQuest Dissertations & Theses database. (UMI No. 3452860)
National Council of Teachers of Mathematics. (2000). Principles and standards for school mathematics. Reston, VA: Author.
Rey, J. G. (2010). The effects of online courses for student success in basic skills mathematics classes at California Community Colleges (Doctoral dissertation). Available from ProQuest Dissertations & Theses database. (UMI No. 3418156)
Ryan, W. J. (2001). Comparison of student performance and attitude in a lecture class to student performance and attitude in a telecourse and a web-based class (Doctoral dissertation, Nova Southeastern University). Available from ERIC database. (ED467394).
Simonson, M. R., Schlosser, C. A., & Hanson, D. H. (1999). Theory and distance education: A new discussion. The American Journal of Distance Education, 13(1), 1-10. doi:10.1080/08923649909527014
Xu, D., & Jaggars, S. S. (2011) The effectiveness of distance education across Virginia's Community Colleges: Evidence from introductory college-level math and English courses. Educational Evaluation and Policy Analysis, 33(3), 360-377. doi:10.3102/0162373711413814