|
Biostatistics for the Health Sciences: Creating an Online Course
Jessica L. Thomson
Louisiana
State
University
Health
Sciences
Center
School
of
Public Health
New Orleans
,
LA
jthoms@lsuhsc.edu
Jennifer Hayden
Louisiana State University Health Sciences Center
School of Public Health
New Orleans, LA
jhayde@lsuhsc.edu
Ray Whiting
Louisiana State University Health Sciences Center
Stanley S. Scott Cancer Center
Louisiana Cancer and Lung Trust Fund Board
Louisiana Cancer Control Program
ray@raywhiting.com
Abstract
This case study outlines the creation and implementation of an asynchronous online course designed to teach introductory graduate-level statistics at the Louisiana State University Health Sciences Center School of Public Health. In designing the course, a variety of software programs were used to enhance specific components of the course website. The course management system used was Moodle, which is open source software. Student responses to surveys as well as the instructor’s own experiences revealed some difficulties with the course implementation, but also an overall feeling of success with the project.
|
The Challenge and the Solution
This case study highlights the redesign of an introductory graduate-level biostatistics course from a traditional classroom setting to a distance learning format. The motivation behind the course redesign was two-fold in nature. First, the course is required for all students in the Louisiana State University Health Sciences Center (LSUHSC) Schools of Public Health, Nursing, and Graduate Studies. As such, it is a high demand course that can create a bottleneck for students. Second, the School of Public Health was in the process of accepting students into all five of its Master of Public Health (MPH) degree concentrations, two of which traditionally have a large number of students coming from the workforce. Likewise, the School of Nursing has a high number of students in the workforce. Offering this course in a distance learning format would greatly benefit those working students, thereby helping to promote the professional development of Louisiana’s workforce. In light of the effects of Hurricane Katrina and its aftermath, the creation of this course could not have come at a more critical time for the LSUHSC schools.
The redesign of this biostatistics course was the result of team effort on the part of the course instructor (first author) and two information technologists working for the School of Public Health. The duties were split between the two information technologists with one assuming responsibility for the layout and design of the course website as well as recording and producing the voice component of the lectures and calculator examples (second author). The other information technologist was essentially responsible for administrative tasks pertaining to the course management system and the animation of worked exercises (third author). Indeed, without the collaboration of these two individuals, the course redesign would never have been undertaken.
The LSUHSC School of Public Health did not have a course management system such as Blackboard or WebCT in place that would have greatly aided the design of an online course. Thus, our first step was to investigate available course management systems. It should be noted that the School of Public Health’s Homeland Defense Program was in the process of purchasing a learning management system called CareerMap2. At that time, using the CareerMap2 system to create a completely asynchronous online course was prohibitively expensive. Therefore, we decided to use a program called Moodle (modular object-oriented dynamic learning environment), a course management system designed to help educators create quality online courses (http://Moodle.org). It is open source software, which means it is free to download, use, modify and even distribute under the General Public License (GNU; http://www.gnu.org/licenses/gpl.html). Moodle runs without modification on the Windows system, is designed in a modular fashion, upgrades easily, and requires only one database which can be shared with other applications. Unfortunately, at the time the project began, the LSUHSC computer systems did not support the PHP platform necessary to run Moodle. However, the problem was easily solved by contracting with an outside hosting service.
Having taught the course for the past three years, the instructor had already incorporated some web-based features into the course. These features included a course website that contained the class syllabus, lecture schedule, PowerPoint presentations of the lectures, and online quizzes. Notably, the quizzes were created using a software program called HotPotatoes (http://hotpot.uvic.ca/), which was discovered by the instructor while attending a Teaching in Higher Education Forum in Baton Rouge, Louisiana. The HotPotatoes program is not freeware, but it is free for those working for publicly-funded, not-for-profit educational institutions. Even with these features in place, much work still remained in order to create a completely asynchronous online course. After many team meetings, it was decided that narration needed to be added to the PowerPoint lectures as well as capturing any mark-ups that the instructor added to the slides during lecture. This task was accomplished using a Tablet PC and the software Camtasia. The worked exercises were animated using the software program Flash to “breathe life” into these otherwise static applications. We felt this would most closely imitate the actual working of problems on a chalkboard that occurs in a traditional classroom. Finally, narrated, animated examples for the TI-83 calculator (recommended for the course) using Camtasia and TI-emulator (http://www.wiscomathematics.com/ti-emulator.htm) were created and added to the course website. While Camtasia is not freeware (cost ~ $300 for a single user), TI-emulator is free to download and use.
The original intent was to teach two sections of the course for the fall 2005 semester, one in the traditional classroom setting and the other in an asynchronous online delivery mode. Students’ final grades and survey responses would then be compared between the two sections for evaluative purposes. Students enrolled in the online section were required to meet five specific criteria: (1) reliable access to a computer with a screen and sound card, (2) high speed internet connectivity, (3) ability to navigate websites, (4) taken a mathematics or statistics course no later than four years previously, and (5) ability to be physically present on campus for the four exam dates. By ensuring that students met these criteria, we wished to avoid any problems associated with inexperienced Internet users. The instructor also felt that an online course would not be an ideal learning environment for students who struggle with mathematically-orientated courses. We felt the high speed Internet access was a must because the course website components loaded and presented excruciatingly slow using a dial-up connection. Finally, the instructor wished to retain physical control of the testing component of the course and hence planned to give all exams in person. Unfortunately, Hurricane Katrina struck just one week after the start of courses at the LSUHSC School of Public Health. Due to the effects of the hurricane and its aftermath, all students wishing to continue with the course were required to take the online section. This forced us to relax all requirements for the course; however, we still strongly recommended that students have reliable access to a computer and a high speed Internet connection.
We would like to note that one good thing did come out of the natural disaster that struck New Orleans and the surrounding area. The LSUHSC schools were determined (come hell or high water, literally) to continue with their fall 2005 academic courses, going to extreme lengths to locate classroom space for the courses and students. However, due to the shortage of suitable classroom space, the School of Public Health opted to switch all of their courses over to a distance learning format using a software program called Elluminate which was interfaced with the course management system CareerMap2. Elluminate (http://www.elluminate.com/support/) allowed instructors to teach their courses in a synchronous mode, requiring instructors and students to be online at the same time. Because we had designed our course to be delivered in an asynchronous mode, we used Elluminate solely for weekly question-and-answer sessions. These sessions were completely voluntary because some students had previous conflicting time commitments.
The main page for the Moodle based asynchronous course is basically presented in outline form in sections or blocks (Figure 1). The first block deals with a general course introduction including links to the course syllabus as well as programs that will be needed throughout the course (e.g. Acrobat Reader). The remaining blocks correspond to the chapters that are covered in the course (Figure 2). In all but the first two chapters, lectures are further broken down by sections which allows students to view and listen to short lecture segments rather than one long, boring narration. Following each lecture section are calculator examples (if appropriate) and worked exercises. At the end of every three to four chapters (corresponding to the exams) are blocks containing links to a review document and an online quiz. Likewise, there are two blocks for course communication. One block is a class news forum for the instructor to communicate course news to the students and the other a student forum for students to communicate with one another.
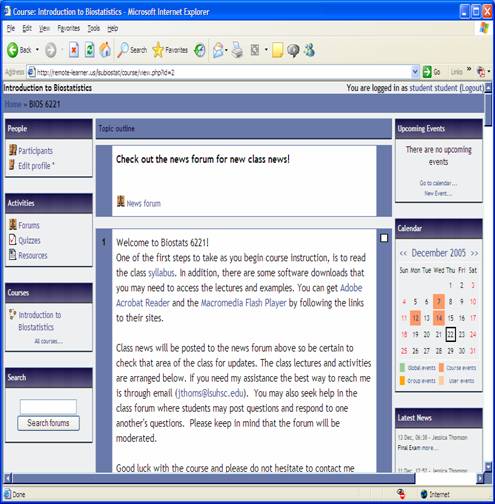
Figure 1: Front Page of BIOS 6221 Course Website
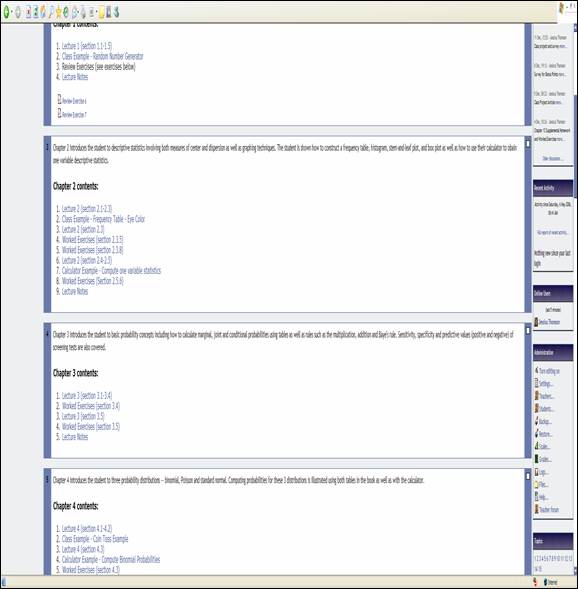
Figure 2: Outline Format of BIOS 6221 Course Website
Before undertaking the redesign of the course from a traditional classroom setting to an online format, the instructor researched the concept of distance education. Because she is a member of the American Statistical Association’s Teaching Statistics in the Health Sciences Section, the search began with this resource. Fortuitously, a discussion was ensuing among the section members concerning distance education. One member had asked for advice on expanding his introductory statistics course into a distance education format. Initially, the responses were quite negative citing various reasons why this expansion was not a good idea. The most common reason by far was that distance education was simply not as effective as face-to-face teaching. However, very quickly, members supporting distance education for statistics courses began to reply, many emphasizing successes with their own distance education courses. Some of these members did agree that distance education was not as effective as face-to-face teaching, but they felt strongly that distance education did have some benefits not to be found in more traditional forms of teaching. Indeed, according to Velleman and Moore (1996), our task as teachers is to use new technology wisely, taking advantage of its substantial strengths while not overlooking the importance of the human factor in education. Additionally, they provide a comprehensive overview of various multimedia tools for teaching statistics including animation, narration, and exercises. Further, in the 2004 Joint Statistical Meetings, two presentations dealt specifically with distance education (Goldman, 2004; Weinstein, 2004).
While there is a multitude of internet sites dealing with distance education, two in particular were found to be quite helpful. The Work-Learning Research website (www.work-learning.com), whose central objective is to improve learning-and-performance practice by bridging the chasm between practitioners and researchers, was one such source. Will Thalheimer, founder and president of Work-Learning Research, states that e-learning’s unique capability is the ease in which instructors can give learners pre-work, coursework, post-work, and reminders (Thalheimer, 2003). Other methods can be used to add these components to courses, but they do so at much greater cost and difficulty. In another article, Thalheimer (2002-2003) gives some very good advice and tips on utilizing e-learning to space learning over time, a teaching technique that improves retention up to 40%. The second source was an online book titled The Theory and Practice of Online Learning. The book presents individual practitioners’ views of the principal pedagogical and course management opportunities and challenges raised by the move to an online environment (Anderson and Elloumi, 2004). Its chapters cover such topics as theory, technology, design, teaching, and support.
Results of the Project
Overall, the authors believe that the course creation and implementation was a success and enjoyed the work involved in redesigning the format to a distance learning mode. More importantly, based upon grades and survey responses, the students also appeared to view the course favorably (although perhaps not quite as much as we did).
Two surveys were administered to the students towards the end of the semester in November and December of 2005. One survey, voluntary and anonymous, was given by the School of Public Health and involved questions concerning the course material and instruction as well as some questions concerning the use of the Elluminate system and distance learning in general. We felt it was important to also receive student feedback specifically on the Moodle component of the course. Therefore, we designed a simple, voluntary survey which included questions concerning the components of the course website, difficulties encountered, and suggestions for improvement. Our survey was not anonymous (bonus points were awarded), although we do recognize the importance of anonymous surveys in obtaining more honest responses from the students (i.e. more critical responses without fear of instructor retaliation). However, we felt it was more important to increase our response rate through the awarding of bonus points than to ensure student anonymity. Further, sinc the course material and instructor specifically, only the results of our survey have been summarized. A copy of our survey may be found in the Appendix.
We had an excellent ret likely due to the fact that bonus points were given for completing the survey. The survey was broken down into seven sections: background, course environment, the four course components consisting of lecture, calculator examples, worked exercises, and exams, and a general section. Table 1 following contains a summary of the seven sections of the survey.
Background: |
n |
% |
Program of study
graduate school/ nursing/ MPH |
8/ 14/ 4 |
30.8/ 53.8/ 15.4 |
Computer used
home/ work/ shared work/both home and work/ other (a) |
20/ 1/ 1/1/ 3 |
76.9/ 3.8/ 3.8/3.8/ 11.5 |
Computer platform – Windows/ Macintosh |
24/ 2 |
92.3/ 7.7 |
Method of internet connection – cable alone or with other
(b) dial-up alone or with other
(c) DSL alone/ wireless alone or with wi-fi |
11/ 5/1/ 9 |
42.3/ 19.2/3.8/ 34.6 |
Experience with distance learning –
little to none/moderate/ a lot |
20/ 5/ 1
|
76.9/ 19.2/ 3.8
|
Website/course management proficiency –
very poor/ adequate/ proficient |
2/ 11/ 13 |
7.7/ 32.3/ 50.0 |
Course Environment: |
|
|
Found course website easy to maneuver about |
25 |
96.2 |
Liked layout of course website |
24 |
92.3 |
Found course calendar useful |
23 |
88.5 |
Found course forums useful |
23 |
88.5 |
Lecture Component: |
|
|
Found narrated lectures helpful |
23 |
88.5 |
Found narrated lectures easy to access |
26 |
100 |
Experienced difficulty accessing/listening |
8 |
30.8 |
Had suggestions for improvement |
8 |
30.8 |
Calculator Component: |
|
|
Found calculator examples helpful |
23 |
88.5 |
Found calculator examples easy to access |
25 |
96.2 |
Experienced difficulty accessing/listening |
4 |
15.4 |
Had suggestions for improvement |
13 |
50.0 |
Worked Exercises Component: |
|
|
Found worked exercises helpful |
26 |
100 |
Found worked exercises easy to access |
26 |
100 |
Experienced difficulty accessing/listening |
1 |
3.8 |
Had suggestions for improvement |
4 |
15.4 |
Exam Component: |
|
|
Format preference – in person/ online |
4/ 22 |
15.4/ 84.6 |
Experienced difficulty with online format |
10 |
38.5 |
Had suggestions for improving submittal process |
9 |
34.6 |
Table 1: Frequency Summary of Survey Questions
a) Students indicated they had used computers in the Learning Resource Center in Baton Rouge and their laptop computers with public wireless internet service at coffee shops and the LSU Student Union.
b) Dial-up, DSL, wireless, work, and/or wi-fi
c) DSL or wireless |
The background questions revealed that eight (31%) of the students were from the School of Graduate Studies, 14 (54%) were from the School of Public Health, and four (15%) were from the School of Nursing. The majority of the students (77%) used their home computers to access the course website, almost all (92%) were using a Windows-based platform, and the most common form of Internet connectivity was cable or some combination of cable, dial-up, DSL, work and/or wireless (42%). The majority of the students (77%) indicated they had very little experience with distance learning, but only 8% indicated that they had very poor proficiency in navigating websites and course management software. Hence, while the students were not experienced in distance learning, they did have sufficient computer skills to use the course website successfully.
The majority of the students (over 88%) indicated positive responses for all four questions concerning the course environment (maneuverability, layout, calendar and forums). For the lecture component, 89% found them helpful, 100% found them easy to access, while 31% experienced difficulties and had suggestions for improvement. For the calculator examples, 89% found them helpful, 96% found them easy to access, while 15% experienced difficulties and 50% had suggestions for improvement. The worked exercises had the best review with 100% of the students finding them both helpful and easy to access, only 4% experiencing difficulties, and 15% having suggestions for improvement. Finally, for the exams, the majority of the students (85%) preferred the online format, 39% experienced difficulty with the online format, and 35% had suggestions for improving the submittal process.
Free form or long answer responses were allowed for some survey questions. By far, the vast majority of these free form responses dealt with Internet connectivity problems, slow downloading, and slow audio of the lecture and calculator examples. The slowness of the audio component can be directly related back to the student’s Internet connection (dial-up) and is not a reflection of poor quality for these components. Some students had excellent improvement suggestions which we will be incorporating into the course website. These included adding the length of each lecture to the course outline, adding play, pause and stop buttons to the calculator examples as was done with the lectures, and linking the calculator examples to examples in the book. Additionally, one student suggested adding narration to the worked exercises. However, we feel that would be disruptive to the intent of these exercises since at present, the student has complete control over the length of time they wish to remain on a single screen. Some students can work through these exercises very quickly and narration would slow them down. Other students need more time to fully grasp the concepts and narration would make the exercises move too quickly for them. As a compromise, we are considering adding a short narration at the beginning of each exercise to explain the technique that is being illustrated.
The last section of the survey dealt with two questions which identified the component the students enjoyed most about the course and the component they liked least. Some students gave more than one like or dislike for their answers. Their responses are summarized following.
Component enjoyed most:
- Independent study/work at own pace/work from home (16 students)
- Ability to review lectures, calculator examples or worked exercises repeatedly (seven students)
- Accessibility of course material at anytime from any place (four students)
- Extra time given for online exams (two students)
- “Excellent” website (two students)
- Audio calculator examples (one student)
- “Awesome” worked exercises (one student)
Component liked least:
- Lack of classroom setting/physical presence of instructor/access to classmates (nine students)
- None; in the words of one student, “all good” (six students)
- Online exam testing/submission process (three students)
- Self-imposed time constraints/need for self-motivation (three students)
- Printing worked exercises (one student)
- Working out of coffee shops (i.e. Internet connectivity; one student)
- Struggle with mathematical/statistical concepts (one student)
While difficulties were encountered throughout the semester, most were resolved quickly and with as little disruption to the students’ learning environment as possible. We recognize, however, that some difficulties remain and will need to be resolved (e.g. online exam submittal process) before the course is offered again in the online format.
Table 2 following contains a summary of students’ grades for the last four years corresponding to the years the current instructor has taught the course. It should be noted that the numbers for the fall 2005 semester are somewhat misleading since there were a total of 72 students enrolled in both sections of the course (52 in the classroom section and 20 in the online section) pre-Hurricane Katrina. The numbers given in Table 1 reflect those students who indicated they wished to continue with the course post-Hurricane Katrina. As the table shows, the proportion of students in each of the grade categories is generally consistent across all four years. The proportion of students receiving an A grade is slightly higher for this year compared to other years, although the difference is not significant (χ2 test; p-value = 0.2635). This slight increase is not believed to be a result of the online format of the course, but rather related to the fact that a more dedicated group of students remained enrolled in the course post-Hurricane Katrina.
|
Percent and Number (n) of Students in Each Grade Level |
Year a |
A |
B |
C |
F |
W |
2002 |
62% (29) |
19% (9) |
2% (1) |
2% (1) |
15% (7) |
2003 |
65% (22) |
9% (3) |
3% (1) |
0% (0) |
24% (8) |
2004 |
49% (22) |
20% (9) |
9% (4) |
2% (1) |
20% (9) |
2005 |
70% (23) |
6% (2) |
21% (7) |
Table 2: Proportion of Students in Grade Categories for Years 2002 – 2005
(Years 2002, 2003 and 2004 were taught in a traditional classroom setting;
Year 2005 was taught in an online setting.)
Suggestions for Others
In the December 2005 issue of the Journal of Online Learning and Teaching, Hensley (2005) gives an excellent and comprehensive list of suggestions for various aspects of distance education. We agree whole-heartedly with his suggestions given in the article. Based on our experiences, we have a few to add that may be more specific to our course content and the system we used. First, we would highly recommend the use of the Moodle course management system to anyone who is considering designing an online course because of its ease of use and flexible design environment. Second, in future course offerings, we will require that students have a high speed Internet connection. Too many difficulties were reported by students using dial-up connections and in fact, the instructor herself was extremely frustrated by her own dial-up connection that was forced upon her due to Hurricane Katrina. Third, the synchronous question-and-answer component of the course was extremely helpful for the students (based on personal comments given to the instructor) and well liked by the instructor. Not only does it allow for more personal contact between the instructor and students, but it is an essential component to any online course, most especially one in which students are required to work statistical or mathematical problems. Last, and arguably most important, adding interactive components to a course website, such as narrated lectures which give students the capability to pause, stop, rewind, and fast forward, can be extremely time-consuming, especially if it requires the instructor to learn new software programs. The collaboration of information technology specialists who have experience with these programs will greatly aid in reducing the amount of time an instructor needs to spend on these course components. It took a full year for the redesign of this course; without the help of the information technologists, it could have easily taken twice that amount of time.
We would like to add one final note concerning the amount of time that was spent by the authors on this project. The SELECT grant was awarded for one year and covered approximately 10% of each of the three author’s time on the project. The additional 10 to 15% of both the instructor’s and two information technologists’ time spent on the project was supported by the LSUHSC School of Public Health.
The authors would like to thank the Board of Regents, all personnel involved with the SELECT grants program, and the BIOS 6221 students of the fall 2005 semester. This project was supported by a SELECT grant, LA-DL-SELECT-18-04/05.
References
Anderson, T. and Elloumi, F., Eds. (2004). Theory and practice of online learning. Athabasca, Canada: Athabasca University. Retrieved January 13, 2005 from www.cde.athabascau.ca/online_book
Goldman, R. (2004, August). Teaching statistics via distance learning at Simmons College. Presentation given at the Joint Statistical Meetings, Toronto, Canada.
Hensley, G. (2005). Creating a hybrid college course: Instructional design notes and recommendations for beginners. Journal of Online Learning and Teaching. 1(2): 1–7. Retrieved January 18, 2006 from https://jolt.merlot.org/documents/Vol1_No2_hensley.pdf
Thalheimer, W. (2002-2003). E-learning’s unique – and seemingly unknown – capability. Retrieved January 13, 2005 from www.work-learning.com/
Thalheimer, W. (2003). E-learning and blended learning: Secrets from the learning research. Retrieved January 13, 2005 from www.work-learning.com/
Velleman, P.F. and Moore, D.S. (1996). Multimedia for teaching statistics: Promises and pitfalls. The American Statistician, 50(3): 217-225.
Weinstein, J. (2004, August). Distance education: How does it work? How is it working? Presentation given at the Joint Statistical Meetings, Toronto, Canada.
Received 22 Feb 2006; revised manuscript received 8 May 2006

This work is licensed under a
Creative Commons Attribution-NonCommercial-ShareAlike 2.5 License.
|