|
Introduction
Students preparing to take college-level mathematics
courses are exhibiting a critical shortage of
higher-level skills. This
nationwide problem is partly attributable to an
over-reliance on memorization. Despite the best
efforts of many mathematics teachers, the problem is
still confounded by using Multiple-Choice (MC)
questions in all high-stakes mathematics assessment
tests (e.g., for high school graduation or college
admission), MC questions have pre-determined correct
or incorrect answers, hence mainly focus on
retention (Becker & Shimada, 2005), In contrast,
problems that allow
students to provide their own constructed
responses are more challenging, allow
multiple variations of the correct answer(s), and
lead students to see the
beauty and creativity inherent in mathematics
(Becker & Shimada, 2005; Jarrett, 2000; Moon &
Schulman).
This article presents an innovative mathematical
expression parser (U.S. patent pending; Livne,
Livne, & Wight, 2007a) that automatically scores
students’ constructed responses to mathematical
questions at the core of a free college readiness
website (http://ruready.net).
Each response is compared to an instructor-provided
reference expression; each response element is
identified as correct vs. missing,
unrecognized, wrong, or redundant, and the response
is assigned a partial-credit score on a
0-100 scale in real-time. The score reflects
both the overall response correctness and the
fraction of correct elements identified in the
response.
The
parser scoring agreed with human teacher scoring to
a very high degree of accuracy and was found to be
as consistent as human scoring. The parser performed
well even when the constructed response assessment
was not clear-cut (either totally wrong or totally
correct), but lay in a “gray area” that required
human expertise to award meaningful partial-credit.
The
parser was further used to score additional
real-world students’ responses to
pre-Calculus questions. The results indicated that
students’ errors were factored into two groups:
structural vs. computational, reflecting the
parser’s ability to distinguish between
different error patterns beyond human scoring.
Literature Survey
Constructed responses to mathematical questions have
been recommended as an effective way to enhance
students’ ability to organize and communicate
knowledge in their own way,
as opposed to Multiple-Choice (MC) questions (Becker
& Shimada, 2005, Jarrette, 2000; Kristin et al.,
2005;
National Science Teachers Association, 2005;
Pehkonen, 1997). Through constructed responses,
students’ incorrect responses are normally awarded
partial-credit, whereas MC responses are scored only
as correct or incorrect; MC questions invite
students to resort to guessing or to solving
problems backward, thereby introducing large
measurement errors. This limitation not only
discourages students from gaining a deep conceptual
understanding in mathematics (McIntosh, & Jarrett,
2000; National Research Council, 1999; Paul, 1993),
but further leads to discrepancies between human
teacher grading and machine grading of the same
student response. Human partial-credit scoring of
constructed responses reflects the number of
learning points that the student has achieved for an
answer that is not fully correct; it especially
forgives small algebraic or arithmetical errors (Beevers
& Paterson, 2002). In contrast, machines face
difficulties in extracting such implicit information
from the student’s response, and score the final
answer only as correct or incorrect, disregarding
the range of “intermediate responses” (Ashton,
Beevers, Korabinski, & Youngson, 2006;
Bennett, Steffen, Singley, Morley, & Jacquemin,
1997). Moreover, many of the current automated
scoring systems exhibit significant scoring errors,
as indicated by 35% of testing offices in 23 states
(CNN, 2007).
Several programs offer solutions to automatic scoring of
constructed mathematical responses. In Praxis I:
Online Academic Skills Assessments (Educational
Testing Service, 1997), constructed responses to
mathematical questions were matched with either one
or a small number of pre-specified answers. The
response was dichotomously scored by literally
matching it against each correct answer, much like
multiple choices. Bennett et al. (1997) developed
questions that have a single correct answer that
may, however, take a large number of forms.
Responses were still only scored as correct or
incorrect. McGuire, Youngson, Korabinski, and
McMillan (2002) offered another type of
partial-credit scoring for automated assessment
tests that was based on the number of solution steps
taken by the learner. For each of four pre-defined
steps, the student provided a single solution and
either received full credit if the step was solved
correctly, or no credit if the step’s solution was
incorrect. The total score was the sum of correct
step scores. None of the scoring techniques cited
above has been validated to be robust, and none
agreed with human scoring across a wide range of
responses; further, these techniques generated only
a final score and could not identify and/or classify
specific error types.
To address these challenges, the University of Utah created
RUReady, a free online self-regulated
learning and assessment website
(http://ruready.net)
intended to improve student college-readiness. The
core of the software is a mathematical expression
parser – a novel analyzing tool that generates
comprehensive error analysis and real-time automated
partial-credit scoring for each student response. To
determine whether the RUReady parser is a valid tool
for automated partial-credit scoring in mathematics,
two research questions were posed: (1) Can a
computer closely match human graders? and (2) Can a
machine surpass human graders by distinguishing
between different types of errors? Accordingly, this
article is divided into three sections. First, the
RUReady parser analysis and its scoring algorithms
are described (Method). Secondly, the validation of
the parser scoring compared against human teacher
scoring is reported (Study 1). Thirdly, the ability
of the parser scoring model to distinguish between
different students’ error-patterns is evaluated
(Study 2). Finally, the results are summarized and
discussed, leading to conclusions, limitations, and
implications for the mathematics teaching community
and for the role of artificial intelligence and
natural languages in education.
Method
RUReady Parser Analysis Algorithm
The RUReady learning program is based on the theory
of learning from error performance (Ohlsson, 1996)
and on evidence that error patterns lead to
conceptual misunderstandings and lack of proper
problem-solving strategies (Babbitt, 1990; Sleight,
2003) as well. (A
parser is an object that recognizes the elements
of a language and translates each element into a
meaningful result).
The parser requires two inputs:
-
Reference: a keyboard-typed string representing the correct
answer to the mathematics question. It is provided
by instructors and stored in a database.
-
Response: a
keyboard-typed string representing a number,
mathematical expression or equation. It is
provided by a student in real-time.
The
parser’s output includes a detailed analysis of the
student’s response, consisting of three successive
phases:
-
Matching: directing comparison of the elements in the reference
and response strings, and reporting whether the
response is a legal expression that adheres to
standard arithmetic and logical syntax rules.
-
Numerical Evaluation: deciding and reporting whether the response and
reference are mathematically equivalent.
-
Analysis: error flagging, i.e. classifying the response’s
individual elements into correct, missing,
unrecognized, wrong, and redundant elements.
Parsers are widely used for matching purposes only
(Phase 1). The RUReady parser design introduces
three additional innovative ideas: (a) numerically
evaluating both the reference and response
expressions for both real and complex variable
values to decide whether they are equivalent (Phase
2). This approach is simpler, more reliable and more
general than computer symbolic algebra systems for
the considered educational applications; it also
allows a user-defined tolerance in comparing the
expressions. Numerical evaluation to verify
expression equivalence has been employed before, for
example WIMS (Gang, 1999); however, the specific
algorithm for choosing sample values and for testing
numerical equivalence is new, and was also verified
to be robust on a large set of student responses;
(b) comparing the response syntax tree in
relation to the specific reference syntax tree,
rather than reducing both to absolute normal
forms and comparing the normal forms; (c) generating
meaningful error flagging (Phase 3), using Approximate
Tree Pattern Matching (ATPM) (Shasha, 1997;
Wang, Zhang, Jeong, & Shasha, 1994). The ATPM
approach computes the edit distance, which is
the minimum number of edit operations required to
transform the response syntax tree to the reference
syntax tree. A byproduct of the minimization
algorithm is a nodal mapping, which pairs
each response tree node with a reference tree
node. Depending on the syntax and complexity of the
expressions, some nodes may have no counterpart.
Each response element (a number, operation, variable
or function) is classified accordingly and
highlighted as correct, missing, unrecognized,
wrong, or redundant. For more details, see Livne,
Livne, and Wight, (2006). An interactive parser demo
is available online at
http://ruready.net/demo, where a user can
provide a reference string and a proposed student
response string, and view images of the generated
parser analysis and scoring. The parser is a
powerful stand-alone tool to detect students’
errors, as well as the backbone of the overall
RUReady learning and assessment system.
Automated Partial-Credit Scoring Model
Based on the parser’s error analysis,
each student response is
assigned a partial score on a continuous
scale of 0-100, as recommended by the National
Assessment Governing Board (2004). The score
is a weighted sum of two
components:
1.
Overall response correctness
(right or wrong) determined by the numerical
evaluation of the mathematical expression in Phase
2. The response and reference strings must be equal
to within a user-defined tolerance (a 10-3
relative tolerance is normally sufficient for
educational applications). This component
assumes a binary value a: a=1 if the response is equivalent
to the reference and a=0 otherwise (see the
first component in Figure 1).
2.
Fraction of correct elements,
which is the number of correct response elements (C)
divided by the total number of correct (C), missing
(M), unrecognized (U), and wrong (W) elements
(identified in Phase 3; redundant elements are not
counted as errors. See the second component in
Figure 1).
Figure 1. The Parser Scoring Model
defines the response
score as a convex combination of the two
components.
The
precise weighting, 0 ≤ θ ≤ 100, of the two
components was optimized in the validation study
described below. The scoring formula was found to be
generally applicable and robust for a large set of
real-world constructed responses to questions in
a college pre-Calculus course. It replaces
current content-dependent rubrics, which require
complicated development and parameter tuning for
specific questions. The parser scoring model is
described in detail in Livne, Livne, and Wight
(2007b).
The
same scoring algorithm can also provide partial
scoring for MC questions: each choice is regarded as
a prospective constructed response, so that
partial-credit is also assigned to each distracter
depending on the error types it contains.
Furthermore, when designing a new question, a
teacher can use the parser score in creating
proposed distracters corresponding to common student
misconceptions. Given that MC questions in all other
assessments are scored as correct/incorrect (for
example, see Villamide et al. 2006), the RUReady
continuous scale provides a substantial improvement
over the current multiple-choice testing framework
(Livne et al., 2007b).
Results
Study 1: Can a Computer Closely Match Human Graders: External Validation
of the Parser Scoring Model?
This study was designed to determine whether the
parser model could closely match human
partial-credit scoring, thereby externally
validating its scoring algorithm. The parser scoring
model was compared directly with human teacher
grading, as recommended by literature (Bennett &
Bejar, 1998).
To that end, three mathematicians, who were both University
mathematics faculty and also teachers of
college-level mathematics courses in high schools,
were asked to independently score (on a scale of
0-100) a sample of 207 real-world mathematical
constructed responses along with their matched
questions. The responses were collected from high
school and pre-college students that had worked
through the RUReady site. In addition to the total
score, the scorers also indicated the number of
structural errors and the number of computational
errors in each response. Because the number of
different scored responses in this study was
relatively large (N = 207), only three scorers were
used. Notwithstanding, this meets the literature
recommendation of three or more graders to ensure a
reliable measure of scoring twenty or more responses
(Seigel, & Castellan, 1988). To examine the degree
of agreement among teachers on scoring the 207
responses, Kendall’s coefficient of concordance,
which is considered the most appropriate measure for
more than two scorers, was used (Gibbons, 1993;
Seigel & Castellan, 1988). The results indicated
that there was strong agreement among the three
human graders on scoring each response; the overall
Kendall’s coefficient of concordance (Kendall, 1948)
was W = .890, p < .0001, regardless of the
level of difficulty of the questions.
Stepwise linear regression was used to predict the human
score by the two parser scoring model components.
Interestingly, the fraction of correct elements
explained 77.3% of the human scoring variance,
whereas the overall correctness contributed only an
additional 5.8%. The optimal weights of the two
scoring components in Figure 1 were (by definition)
their loading coefficients in the final regression
(θ≈30, 100–θ≈70 for the overall correctness and
fraction of correct elements, respectively); with
these weights, the parser scoring model explained an
impressive 83.1% (the sum of 77.3% and 5.8%) of the
human scoring variance, which is equivalent to a
human-parser score correlation coefficient of r =
.910, p < .0001. See Table 1.
Table 1. Stepwise Regression Analysis of Predicting
Human Teacher Scoring by the RUReady Parser Scoring
Components
|
Parser Component Predictor |
Correlation Coefficient r
(cum.) |
R2 =
Variance Explained (cum.) |
Optimal Loading |
|
Fraction of correct elements |
0.882 |
77.3% |
68 |
|
Overall correctness |
0.910 |
83.1% |
32 |
The
concordance of the human and parser scoring scales
was examined by the regression line slope. As
illustrated in Figure 2, the slope was 0.97,
indicating that a parser score of 100 corresponded
to a human score of 97. Thus, the two scales almost
coincided. Overall, the results indicated that the
parser scoring model closely matched human scoring,
ensuring that every student response in the RUReady
site is automatically awarded accurate
partial-credit, similar to what a human teacher
does.
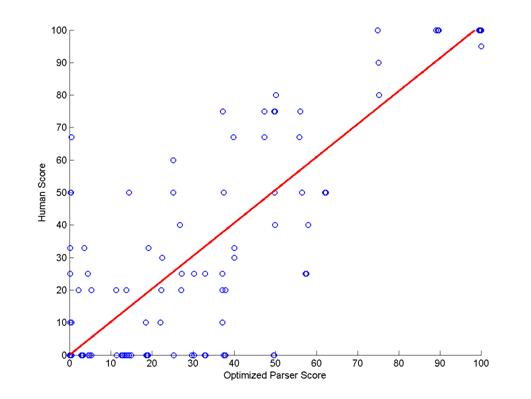
Figure 2. Scatter-plot and regression
line of RUReady parser scoring (horizontal axis)
versus
human teacher scoring (vertical axis) of
mathematical constructed responses.
To
determine whether the parser scoring was a
consistent measure, it was compared against the
average and variation in human scoring. First, the
standard deviation (SD) of the three teacher scores
was computed for each of the 207 responses. Then,
the difference (PD) between the parser score and the
average teacher score was computed for each of these
responses. The consistency of the two
scoring methods (human and
computer) was compared by means of a
paired sample t-test on
the difference between the mean SD and the
mean PD. Because the correlation between the parser
and human scorings was high, it was anticipated that
the two scoring methods would be consistent.
As
expected, the difference between the two means was
not significant across all 207 responses (MSD
= 9.923, SD = 12.291 and MPD = 10.583,
SD = 15.045, t(206) =
-.618, p = .537). This implied that the
parser scoring algorithm matched human teacher
scoring and exhibited equal consistency and
reliability.
To
illustrate the human-parser scoring match, consider
the question:
“What is the point-slope equation of the line
perpendicular to the line
2x - 9y = 22 and containing the point
(27,-19)?”.
The
correct answer is y + 19 = -(9/2)(x-27) ,whereas
the student’s response was y + 19 = (2/9)(x-27).
This response was scored 70, 67 and 50 by the three
teachers, while the parser’s score was 55 (30 times
the overall correctness (0) plus 70 times the
fraction of correct elements, which was 0.786).
While the teacher mean score was 62.3 with a
reerpendicular lines, albeit correctly using the
point-slope formula. Based on this heuristic, a
score around 50 (one correct concept out of two)
would be expected. Nevertheless, each teacher
penalized and scored the student’s response
differently. This illustrates that the parser
scoring was meaningful even when the score
assignment was not clear-cut (either a totally wrong
or a totally correct response), but lay in a “gray
area” that required human expertise to award
meaningful partial-credit.
Study 2: Can a Machine Surpass Human Teacher Scoring: Automatic Detection
of Student’s Structural versus Computational Error
Patterns?
Based on the validity and reliability of the parser
scoring model described above, a second study was
conducted to ascertain whether the different error
types detected by the parser corresponded to
different error patterns exhibited by students.
Specifically, 124 additional real-world students’
constructed responses to
pre-Calculus questions were analyzed and scored
by the parser. To examine the internal
structure of the error types and decide whether they
could be clustered, exploratory factor analysis with
a varimax rotation method was conducted (Hair,
Anderson, Tatham, & Black, 1995). It yielded two
distinct factors (error groups) that explained an
impressive 76% of the original error elements’ joint
variance: (1) Error Group 1 included the
missing and unrecognized
elements, with factor loadings of .768 and
.822, respectively; (2)
Error Group 2 included
wrong elements only, with
a factor loading of .986. Moreover, to
examine whether the two Error Groups’ average
frequencies were different, a paired sample t-test
was used. The result indicated that the mean
percentage of elements in Error Group 1 of the total
number of response elements (20.242%) was
significantly higher than that of Error Group 2
(10.747%) across all 124 responses (t(123)
= -4.380, p < .0001). Cohen’s d, which
is the appropriate effect size coefficient for a
t-test (Cohen, 1988) was .661, indicating that the
two Error Groups were indeed distinct for a
relatively small response sample size (a value of
d =.5 is considered a medium effect size; see
Cohen, 1992). Taken together, these results
indicated that two distinct types of errors were
detected in students’ responses.
To further investigate whether the two error groups
identified by the parser had different effects on
predicting the score of students’ responses,
stepwise linear regression
was performed. The results indicated that
missing and unrecognized
elements combined (Error Group 1) explained 36%
of the student
score, representing structural errors that
might reflect conceptual errors, while wrong
elements (Error Group 2) contributed only 19%,
representing computational errors that could
also be a result of typographical errors. Taken
together, the two error patterns explained 55% of
the students’ scores, which was equivalent to
an error-score correlation of r = .74, p <
.0001. The correct parts explained 45% of the
scores’ variance. These
findings supported Orton’s (1983) results that
Calculus responses of college students were
classified into ‘structural’ versus ‘executive’/computational
errors. Structural errors were those "which
arose from some failure to appreciate the
relationships involved in the problem or to grasp
some principle essential to solution (Orton,
1983, p. 236)." In
contrast, ‘executive’ errors involved failure
to carry out computational manipulations, though the
principles involved may have been understood (Orton,
1983). Moreover, our results were also in line with
previous postulations that
student error patterns generally fall under two
categories: bugs and slips (Acton,
Johnson, & Goldsmith, 1994,
Ginsberg, 1987).
Bugs represent
systematic conceptual errors that are consistently
made by a student and in our study could possibly
correspond to Error Group 1. Slips represent minor
deficiencies in applying the correct rules and
techniques to the solution process that presumably
correspond to Error Group 2.
To
determine whether teachers used similar error
detection heuristics to give partial-credit scores,
stepwise regression was also conducted to predict
human teacher scores using the structural and
computational Error Groups. The results showed that
Error Groups 1 and 2 explained 18% and 15% of the
human scoring variance, respectively. Taken
together, the two Error Groups explained 33% of the
variance in the teacher scores, which corresponded
to an error-score correlation of r = .58, p <
.0001. These results lead to two assertions: (a)
although the parser and teacher total scores
concurred, teachers penalized students almost evenly
on structural (account for 18% of their total score)
and computational errors (15%); the parser penalized
students twice as much on structural errors (36%)
than on computational errors (19%); (b) teachers
focused more on correct parts of students’ responses
(67%) and less (33%) on students’ error patterns; in
contrast, the parser gave similar weights to both
the correct and erroneous parts of the student’s
response (45% and 55%, respectively, as cited
above).
In
particular, human graders ran into difficulties when
asked explicitly to classify students’ errors into
structural and computational error groups
(patterns), similar to those generated by the
parser. There was a very low agreement among the
teachers on error classification, and each teacher
came up with different error grouping (W =
.106 and W = .021, p = .012 for the
structural and computation error groups,
respectively). Moreover, the correlation between the
mean number of structural errors defined by the
teachers and the sum of missing and unrecognized
elements detected by the parser, was relatively low
(r = .456, p < .0001); the
corresponding correlation for the computational
error group was not significant at all. The results
indicated that human graders failed to establish a
systematic heuristic to detect error patterns in
students’ responses. In contrast, the parser
provided a consistent mechanism to distinguish
between the two main error types in students’
responses.
Discussion, Limitations, and Implications
The
current article describes a novel parsing system
that automatically scores students’ constructed
responses to mathematics questions, based on the
errors in each response. This computerized scoring
provides a good match to human grader scoring, and
goes beyond human graders in distinguishing between
two types of error patterns: structural possibly
reflecting conceptual errors and computational
possibly resulting from typographical errors.
The
findings provide evidence that the parser generates
partial-credit scores to constructed responses in
mathematics that are very similar to human-generated
scores. This indicates that the parser scoring model
can replace human scoring, thus, positively
answering the first research question posed in this
article, viz., Can a computer closely match human
graders? The machine scoring was at least as
consistent as humans, owing to a uniform scoring
formula as opposed to frequent inter-teacher scoring
deviations. Furthermore, it generated automatic
partial-credit scoring at a much higher speed than
manual grading by humans. The authors anticipate
that these advantages of the parser scoring will be
more pronounced in a larger sample of human scorers
as well as in larger response samples.
Furthermore, although
the overall scores given by the parser and human
graders were highly correlated, the results support
the postulation that the parser can further unveil
human scoring errors and distinguish between
two main types of student error patterns, two areas
in which human graders fall short. The value of
engaging students in the analysis of their errors
has long been recognized in computer programming,
where students are expected to debug their incorrect
programs (Melis, 2004). Similarly, the parser’s
unique capability to generate error feedback by
highlighting correct versus erroneous elements
(i.e., incorrect, missing, unrecognized or
redundant) for each response, stimulates students to
figure out what went wrong, organize error patterns
(Livshits & Zimmermann, 2005; Melis, 2004), and find
their corrections (Babbit, 1990). Through analyzing
their errors, students develop a deep understanding
of why the answer was wrong and what the
mathematical concepts behind it were, rather than
focus on how the problem could be solved with
a rule or formula (Melis, 2004, 2005; Oser & Hascher,
1997; Russell, 2007). Error feedback was found to be
the most reliable mode to reduce common errors in
mathematics and to increase students’ understanding
and performance (Koedinger & Anderson, 1990; Larkin
& Simon, 1987; Melis, 2004; Novick, 2001). In
contrast, human graders often tend to largely avoid
pointing out and grading individual error patterns;
instead, they focus more on what the student knows,
relying on the traditional yet disputable
behaviorist view that errors could interfere with
fixing the correct result in the student’s mind
(Miller, 1983). Accordingly, it is concluded that
the parser can surpass human grading in detecting
errors patterns, as hypothesized in the second
research question.
Overall, the answer to the title question is YES:
Automated machine scoring can surpass hand-grading
of constructed responses and error patterns in
mathematics.
The RUReady parser is still limited to scoring only the final answer, as
opposed to examining all of the intermediate steps.
This limitation is particularly evident when the
final answer is a number, which might nevertheless
be a complex function of several intermediate stages
that reflect back on errors made during the
problem-solving process. Future plans call for
parsing intermediate solution stages, as well as
inferring on different types of errors made during
the whole solution process. This will allow
the detection of the sources of different error
types, thereby identifying the conceptual versus
computational or typographical errors. Moreover,
creative open-ended problems that have multiple
solution paths but only one final answer could then
be employed (Becker & Shimada, 2005), revealing the
level and the quality of student mathematical
understanding (Magone, Cai, Silver, Wang,1994; Moon
& Schulman, 1995). The authors also plan
longitudinal studies to investigate the capability
of the RUReady assessments to predict student
success in specific college-level courses in
mathematics.
Notwithstanding, the parser evidently illustrates
that natural languages and artificial intelligence
principles can be used successfully to detect
student error patterns. Additionally, the RUReady
parser offers several advantages over the
limitations of multiple-choice questions in
automated assessment tests. It provides automatic,
immediate partial-credit scoring of computerized
mathematical exams, which need not be hand-graded as
with other systems. The exclusive use of questions
that require constructed responses also fosters the
development and measurement of creative
problem-solving skills. The same technology enables
the construction of online learning tools that
generate immediate automated error feedback to guide
student learning in real-time. It provides a tool
for teachers to design concept-based instructional
units tailored to student’s individual
misconceptions. Further, it allows teachers to
construct multiple-choice mathematical questions
that are scored on a continuous scale, much like
constructed responses. Future studies could explore
the optimal distribution for MC continuous scores,
as described in more details elsewhere. (Livne, et
al., 2007b).
In
conclusion, the RUReady parser constitutes an
important tool to enhance college readiness in
mathematics on a broad scale. By taking full
advantage of the low cost per student of machine
scoring, it is now feasible to construct automated
online learning tools to help level the playing
field for underrepresented student populations and
promote diversity in science, mathematics and
engineering disciplines.
References
Acton, W. H., Johnson, P. J. and Goldsmith, T. E.
(1994). Structural Knowledge Assessment: Comparison
of Referent Structures. Journal of Educational
Psychology 86, 303-311.
Ashton, H. S., Beevers, C. E., Korabinski, A. A., &
Youngson, M. A. (2006). Incorporating partial-credit
in computer-aided assessment of mathematics in
secondary education. British Journal of
Educational Technology, 37(1), 93-119.
Babbitt, B. C. (1990). Error patterns in problem
solving. Paper presented at the International
Conference of the Council for Learning Disabilities.
Austin, TX.
ERIC #:ED338500.
Retrieved April 25, 2007, from
http://eric.ed.gov/ERICWebPortal/Home.portal?_nfpb=true&_pageLabel=RecordDetails&ERICExtSe
arch_SearchValue_0=ED338500&ERICExtSearch_SearchType_0=eric_accno&objectId=0900000b8004e2b2
Becker, J.P., & Shimada, S. (2005). The open-ended
approach: A new proposal for teaching mathematics.
Reston, VA: National Council of Teachers of
Mathematics.
Babbitt, B. C. (1990). Error patterns in problem
solving. Speeches/Meeting Papers.
ERIC:
ED338500. Retrieved April 25, 2007, from
http://eric.ed.gov/ERICWebPortal/Home.portal?_nfpb=true&_pageLabel=RecordDetails&ERICExtSe
arch_SearchValue_0=ED338500&ERICExtSearch_SearchType_0=eric_accno&objectId=0900000b8004e2b2
Beevers, C., & Paterson, J. (2002). Assessment in
mathematics. In P. Kahn, & J. Kyle, (Eds.),
Mathematics and its applications (pp. 51-53).
Sterling, VA.: Stylus Publishing Inc.
Bennett, R. E., & Bejar, I. I. (1998). Validity and
automated scoring: It‘s not only the scoring.
Educational Measurement: Issues and Practice,
17(4), 12-17.
Bennett, R. E., Steffen, M., Singley, M. K., Morley,
M., & Jacquemin, D. (1997). Evaluating an
automatically scorable, open-ended response type for
measuring mathematical reasoning in
computer-adaptive tests.
Journal of Educational Measurement, 34(2),
162-176.
CNN Online
(3/28/07). Testing companies struggle to meet
NCLB demands. Retrieved May 2, 2007, from:
http://www.cnn.com/2007/EDUCATION/03/25/nclb.standardized.test.ap/index.HTML
Cohen, J. (1988). Statistical power analysis for
the behavioral sciences (2nd ed.).
Hillsdale, NJ: Erlbaum.
Cohen, J. (1992). A power primer. Psychological
Bulletin, 112(1), 155-159.
Educational Testing Service (1997). The PRAXIS
SeriesTM. The PRAXIS Series,
Educational Testing Service, Inc. Retrieved February
1, 2007, from
http://www.ets.org/portal/site/ets/menuitem.fab2360b1645a1de9b3a0779f1751509/?vgnextoid=48c0
5ee3d74f4010VgnVCM10000022f95190RCRD
Gang, X. (1999). WIMS: A server for interactive
mathematics on the internet. Retrived, August 25,
0.0pt;font-family:Arial">Gibbons, J. D. (1993).
Nonparametric measures of association.
Sage University Paper series on Quantitative
Applications in the Social Sciences, 07-091. Newbury
Park, CA:Sage.
Ginsburg, H. P. (1987). How to assess number facts,
calculation, and understanding. In D. D. Hammill
(Ed.), Assessing the abilities and instructional
needs of students (pp. 483-503). Austin, TX:
PRO-ED.
Hair, J. F., Jr., Anderson, R. E., Tatham, R. L.,&
Black,W. C. (1995). Multivariate data analysis
with reading (4th ed.). Upper Saddle
River, NJ: Prentice Hall.
Jarrett, D. (2000). Open-ended problem solving:
Weaving a web of ideas. The Northwest
Regional Educational Laboratory's Mathematics and
Science Education Center (Volume 1 Number 1).
Retrieved August 23, 2007, from
http://www.nwrel.org/msec/images/nwteacher/spring2000/open.pdf
Kendall, M. G. (1948). Ranking correlation
methods. London: Griffin.
Koedinger, K. R., & Anderson, J. R. (1990).
Abstract planning and perceptual chunks: Elements of
expertise in geometry. Cognitive Science,
14, 511-550.
Kristin, A. Peterson, K. A., Davison, M. L.,
Hjelseth, L., Angermeyr, J., Hodges, T., Kochmann,
R., Mattson, D. Weiss, D. J. (2005). Computerizing
statewide educational assessments in Minnesota: A
report on the cost and feasibility of converting the
Minnesota comprehensive assessments to a
computerized adaptive format. Minneapolis, MN:
University of Minnesota Office of Educational
Accountability College of Education and Human
Development.
Larkin, J.H., & Simon, H.A. (1987). Why a diagram is
(sometimes) worth ten thousand words. Cognitive
Science, 11, 65-99.
Livne, N., Livne, O. & Wight, C. (2006). Automated
error analysis through parsing mathematical
expressions in adaptive online learning. In T.
Reeves & S. Yamashita (Eds.), Proceedings of
World Conference on E-Learning in Corporate,
Government, Healthcare, and Higher Education 2006
(pp. 1321-1325). Chesapeake, VA: AACE.
Livne, N. L., Livne, O.
E., & Wight, C. A. (2007a). System and method of
analyzing freeform mathematical responses.
Patent Application, DOCKET NO. 00846-25702.PROV.PCT,
filed February 2007.
Livne, N. L., Livne, O.E., & Wight C. A. (2007b).
Automated assessment of creative solutions in
mathematics through comparative parsing. In A-G. Tan
(Ed.), Creativity: A handbook for teachers
(pp. 399-419). Singapore: World Scientific
publishing Co. Pte. Ltd.
Livshits, B., & Zimmermann, T. (2005, September
5–9). DynaMine: Finding common error patterns by
mining software revision histories. Paper presented
at the Proceedings of the 10th European Software
Engineering Conference held jointly with 13th
ACM SIGSOFT international symposium on Foundations
of Software Engineering (pp.296-305), Lisbon,
Portugal. Retrieved August 27, 2007, from
http://portalparts.acm.org/1090000/1081706/fm/frontmatter.pdf
Magone, M., Cai, J., Silver, E. & Wang, N. (1994).
Validating the cognitive complexity and content
quality of a mathematics performance assessment.”
International Journal of Educational Research, 12,
317–340.
McGuire, G. R., Youngson, M. A., Korabinski, A. A. &
McMillan, D. (2002). Partial-credit in mathematics
exams: A comparison of traditional and CAA exams.
Proceedings of the 6th International
Computer Assisted Assessment Conference (pp.
223–230). Loughborough University.
Melis, E. (2004, 15-17 December). Erroneous examples
as a source of learning mathematics. Paper Presented
at the International Association for Development
of the Information Society Conference for Cognition
Exploratory Learning in Digital Age (CELDA),
Lisbon, Portugal. Retrieved December 5, 2006, from
http://www.activemath.org/publications/Melis-Erroneous-CELDA04-2004.PDF
Melis, E. (2005, July 18-22). Design of erroneous
examples for ActiveMath. Paper presented at the
12th International Conference on Artificial
Intelligence in Education (AIED 2005).
Amsterdam, the Netherlands: University of Amsterdam.
Retrieved August 22, 2007, from
http://www.ags.uni-sb.de/~melis/Pub/aied05final.pdf
McIntosh, R., & Jarrett, D. (2000). Teaching
mathematical problem solving: Implementing the
vision: A literature review. Portland, Oregon:
Mathematics and Science Education Center, North West
Regional Laboratory. Retrieved January 23, 2007,
from
http://www.nwrel.org/msec/images/mpm/PDF/monograph.PDF
Miller, P.H. (1983). Theories of developmental psychology. San Francisco, CA: Freeman.
Moon, J. & Schulman,
L. (1995). Finding the connections: Linking
assessment, instruction, and curriculum in
elementary mathematics.
Portsmouth, NH: Heinemann
Publisher.
National Assessment Governing Board. (2004). Mathematical framework for the NAEP assessment 2005.
 U.S. Washington, D.C.: U.S. Department of Education National Assessment of Educational Progress.
National Research Council (1999). High stakes:
Testing for tracking, promotion, and graduation
(p. 45). Washington: National Academies Press.
Retrieved March 24, 2007, from
http://darwin.nap.edu/books/0309062802/html/71.html
National Science Teachers Association. (2005).
Critical Issue: Multiple dimensions of assessment that
support student progress in science and
mathematics.
Washington, D.C.: U.S. Department of Education,
North Central Regional Educational Laboratory.
Novick, L. R. (2001).
Spatial diagrams: Key instruments in the toolbox for
thought. In D. L. Medin (Ed.), The psychology of
learning and motivation (Vol. 40, pp. 279-325). San
Diego, CA: Academic Press.
Ohlsson, S. (1996). Learning from performance
errors. Psychological Review, 103(2), 241-262.
Orton, A., (1983). Students' understanding of
differentiation, Educational Studies in
Mathematics, 14, 235-250
Oser, F. & Hascher, T. Lernen aus fehlern - zur
psychologie des negativen wissens .
Schriftenreihe zum Projekt: Lernen Menschen aus
Fehlern? Zur Entwicklung einer Fehlerkultur in der
Schule, Pädagogisches Institut der Universität
Freiburg, Schweiz.
Russell, D. (2007). The most powerful learning
experiences often result from making mistakes.
About.com: Mathematics. Retrieved August 24,
2007, from
http://math.about.com/library/weekly/aa011502a.htm
Paul, R. W. (1993). Pseudo critical thinking in the
educational establishment: A case study in
educational malpractice. Sonoma, CA: Sonoma
State University, Center for Critical Thinking and
Moral Critique.
Pehkonen, E. (1997). The state-of-art in
mathematical creativity.
ZDM
- Zentralblatt für Didaktik der Mathematik, 29, 63-67.
Seigel, S., & Castellan, N. J. Jr. (1988).
Nonparametric Statistics for the Behavioral Sciences
(2th
ed.). New York: McGraw-Hill.
Shasha, D., & Zhang, K. (1997). Approximate tree
pattern matching. In A. Apostolico & Z. Galil
(Eds.), Pattern matching in Strings, Trees and
arrays (pp. 341-371). UK: Oxford University
Press. Retrieved January 13, 2007, from:
http://citeseer.ist.psu.edu/shasha95approximate.HTML
Sleight, D. A. (2003). Use of paper-based support
tools to aid the acquisition of cognitive skills
during unsupervised practice. Interactive
Learning Environments, 11(1),
3-22.
Villamide, M. J., Alegre, Y., Alvir, M.R., Carabaño,
R., Nicodemus, N., &
Menoyo, D. (2006, November 22-25). A survey of
AulaWeb question types for continuous evaluation in
a mandatory course. In A. Méndez-Vilas, A. Solano
Martín, J.A. Mesa González & J. Mesa González
(Eds.), Proceeding of the 5th
International Conference on Multimedia and
Information and Communication Technologies in
Education: Technological Science Education,
Collaborative Learning, Knowledge Management
(pp. 1152-1155). Badajoz, Spain: FORMATEX (2006):
Wang, J.
T. L., Zhang, K., Jeong, K. & Shasha, D. (1994).
A
system for approximate tree matching. Institute
of Electrical and Electronics Engineers (IEEE)
Transactions on Knowledge and Data Engineering,
6(4), 559-571.
|