Introduction
In online teaching and learning, it is difficult for instructors to observe students’ learning behaviors (Mor, Minguillon & Carbo, 2006). However, if instructors could dynamically and scientifically observe, monitor, and track learners’ online behaviors, they might then be able to provide adaptive feedback, customized assessment, and more personalized attention as needed (Nanjiani, Kelly, & Kelly, 2004). With scientific methods to monitor learners’ activities as they occur, online instructors may also help students to establish a pattern, or patterns, of successful learning activities (Neuhauser, 2002). Currently, online instructors rely heavily on the learning management systems ( LMS ) or course management systems ( CMS ), which provide basic data about learners’ activities, such as login frequency, visit history and message numbers on the discussion boards, etc. This type of information helps online instructors only to a limited degree to understand their students’ online learning progress.
Since learner activities are crucial for effective online learning, it is necessary to search for scientific methods to better observe and monitor these activities and patterns in the online environment (Neuhauser, 2002). However, limited research is available on online learning behaviors and learning activity patterns. Server logs automatically collected and stored in LMS / CMS are a good resource to help understand the virtual learning phenomenon. The LMS logs store and archive various learning behaviors, such as a sequence of link choices through a course website. Statistical analysis of these server logs may help uncover student learning patterns, such as who has visited the course website, when it was visited, how long it was visited, how the website was used, and more (Fichter, 2003).
Data mining (DM) is a series of data analysis techniques applied to extract knowledge from raw log data. Such techniques have been widely used in business (Chen, Sakaguchi, & Frolick, 2000; Marjamaa, 2003). Through the knowledge-discovery process, implicit and potentially useful information is extracted from the raw data (e.g., server logs) (Roiger & Geatz, 2003). The purpose of this study was to analyze server logs, to construct knowledge on typical patterns of online learning behaviors, to further discover the unique advantages of data mining techniques to support dynamic online instruction, and to build a predictive model for online learning (Novak, Gavrin, Christian, & Patterson, 1999).
Literature Survey
Data Mining
Data mining is a process of employing one or more computer learning techniques to automatically analyze and extract knowledge from data contained within a database (Roiger& Geatz, 2003). Unlike general quantitative data analysis methods employed in educational research, DM is “the extraction of hidden predictive information from large databases” (Wang, 2003, p. 220) with “sophisticated statistical analysis and modeling techniques to uncover patterns and relationships hidden in organizational databases” (p.221). In general, there are two categories of DM techniques (Chen et al., 2000): one is the use of statistical models (e.g., probability distributions, correlation, regression, cluster analysis, and discrimination analysis) to evaluate hypotheses and results; and the other is often referred to as “machine learning” with artificial intelligence technologies to build predictive models (Tseng, Tsai, Su, Tseng & Wang, 2005).
Educational data mining
Educational Data mining (EDM) is a very new academic field. The first few publications on EDM appeared in 2006, and there are presently fewer than 30 researchers who focus on EDM from the fields of computer science, information systems, and education (Winters, 2006). Currently, EDM research methodology mostly follows the research process of web usage mining, developed by marketing researchers to study online consumer behavior s, which can be simply categorized into browsing and buying. Online learning behaviors, on the other hand, are more complex. Many online activities and communications occur during the online learning process. This study will try to differentiate as many online learning behaviors as possible. Ongoing efforts are needed to develop standard procedures for educational web usage mining and learning behavior differentiation. The following sections review selected EDM studies.
Optimal learning path discovery
The concept Map Model (Novak, 1998) stresses the importance of prior knowledge for learning new concepts, and thus may be employed to visualize the prerequisite relationships among complex concepts. Hwang and colleagues (Hsu, Tu, & Hwang, 1998; Hwang, 2003) worked on concept map model development, and utilized association and fuzzy techniques to develop an intelligent tutoring system that provided dynamic learning suggestions based on the analysis of learning materials and test results. For example, through association and fuzzy analyses, they found that the students who answered Question 1 incorrectly all answered Question 2 incorrectly in their study. Conversely, 75% of the students who answered Question 2 incorrectly would also incorrectly answer Question 1. Thus, if solutions to Question 1 required concept A, and solutions to Question 2 needed concept B, based on the above analysis, a student must know concept A before they can grasp concept B. One may then conclude that concept A is prerequisite knowledge for concept B.
DM techniques can be applied to discover relationships among concepts, facts, and other learning objects, and thus construct concept maps reflecting these relationships. Su and colleagues (Su et al., 2006) utilized similar concepts to identify the optimal learning path for learners. They classified students into clusters based on gender, age, learning style, cognitive style, and media preference. They assumed that different clusters should have their unique learning path to achieve the best learning performance. They used the decision tree technique to build a model to provide a personalized learning path. Huang, Chen, & Cheng (2007) suggested traditional single-level learning path mining is not sufficient. They proposed a methodology for mining frequent patterns of learners’ behaviors (Mor et al., 2006; Su et al., 2006) that connects a hierarchical scheme to provide cross-level learning suggestions for the next learning course. Therefore, learners can get multiple learning route suggestions instead of one.
Instructional strategy and course design improvement
Merceron & Yacef (2005) conducted Learning Process Analysis to identify at-risk or failing students. This technique was also applied to discover the relationships between learners’ performance and different strategies employed by the instructor (Chen, Liu, Ou & Liu, 2000). Association and clustering techniques (e.g., Merceron & Yacef, 2005) and the decision tree technique (e.g., Chen et al, 2000) were particularly useful in such discovery efforts. Zaiane (1998, 2001) also analyzed server logs to understand online learners’ behaviors and then improved the web-based learning environment accordingly.
Research questions
A few research studies started the innovative applications of DM techniques in educational technology development. However, these studies focused mostly on algorithm development instead of educational applications. Clearly, educational research with DM techniques has great potential and is particularly needed for improving online teaching and learning, but it is still at the initial stage, and more studies are needed. This study, therefore, was conducted to answer the following questions:
- What are the typical online learning behaviors of undergraduate students in Taiwan , as discovered through data mining techniques?
- What are the typical patterns of online learning behaviors of undergraduate students in Taiwan ?
- What are the most important predictive indicators for learning outcomes of undergraduate students in an online learning environment in Taiwan ?
Research design and Method
Context, Participants, and Data source
The study was conducted in an undergraduate course on Business Software Applications in a four-year vocational-track university (see definition in Government Information Office, 2004; Zhang & Hung, 2006) in Taiwan . The course was delivered completely online via Wisdom Mater v.2.4, a widely used course management system in Taiwan . In a project-based learning (PBL) approach, the online learning experience required active collaboration among students. Ninety-eight students’ online learning behaviors were recorded in server logs for six consecutive weeks. A total of 17,934 sever logs were retrieved from the LMS and analyzed in this study.
Data Preparation and Analysis Procedures
Figure 1 illustrates the data preparation and analysis procedure of this study. First, a Search Query Language (SQL) query was conducted to retrieve a variety of data from the LMS server, and then log records were saved to Oracle 10G Express, a database management system. The data preprocessing, exploration and analysis process included the following web usage mining procedures (Becker, Vanzin, Marquardt & Ruiz, 2006): the data preprocessing phase, the data mining phase, and the pattern analysis phase.
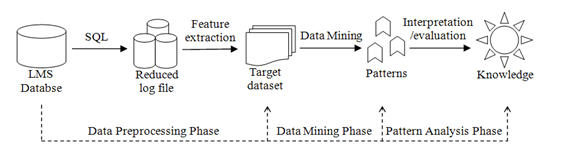
Figure 1. Data Preparation and Analysis Procedures
The data preprocessing phase was performed using a reduced log file, which was “cleaned” by removing all useless, irregular, and missing data from the original LMS common log file. After the initial preprocessing, a session filter was applied to the reduced log file for feature extractions. The purpose of the filter was to aggregate all user requests within a session into a single set of variables. For example, a session typically started when a student logged in to the LMS , and ended when the student pressed the exit button. However, sometimes the session would be terminated when a student accidentally closed the web browser, or a student might stay idle with the course website open yet doing nothing. In the latter instance, the LMS would terminate the session automatically after 20 minutes of inactivity. In these cases, the related raw data stored were removed from the database to reflect only normal learning events of the students as per the purposes of this study. Feature extractions filtered out the following primary variables: user identifier, session identifier, session start date and time, session end date and time, user’s hit count, and session duration in minutes (Mor et al., 2006). Derived variables (duration and frequency of data of each student) were extracted through calculating or accumulating primary variable data on a daily and weekly basis. These variables were transformed into fields, assigned with proper data attributes, and stored in the database management system. All data fields were organized with tables and formed a rational database. Table 1 shows a partial list of primary and derived variables from server logs.
Table 1. An Example of Primary and Derived Variables
Variable Name |
Description |
ID |
User ID |
LoginFre |
Total frequency of LMS logins |
LastLog |
When was the last time logged into LMS |
ClassFre |
Total frequency of accessing course materials |
LastClass |
When was the last time accessed course materials |
NoPosting |
Total number of bulletin board messages posted |
DisFre |
Total number of synchronous discussions attended |
ReadHr |
Ho urs spent reading bulletin board messages |
ReadMegs |
Total number of bulletin board messages read |
The data mining phase included two sub-phases: (a) descriptive analysis, and (b) artificial intelligence analysis. Descriptive analysis (Maimon & Rokach, 2005; Roiger & Geatz, 2003) was used with summarizing, clustering, and association rules techniques to generate an overview on the dataset, to gain an insight into students’ characteristics, and to depict students’ learning patterns. Artificial intelligence analysis was used for predictive purposes (Hastie, Tibshirani, & Friedman, 2003). The decision tree technique was applied to build a predictive model of online learning performance.
The pattern analysis phase included data interpretation and evaluation of the results. This phase was needed to identify meaningful results from outcomes of the data mining phase. Details of variables and further analysis were uncovered in the data mining phase and discussed in the pattern analysis phase.
Analytic tools and methods
Two open source data mining software packages, Weka (Witten & Frank, 2005) and Knime (Konstanz University, 2006), were used to perform descriptive and artificial intelligence analysis. SPSS was utilized to perform SQL queries and data visualization.
The purpose of descriptive analysis was to construct an overview of how all students were doing in a given time frame. Processed data were visualized through tables and graphics. The graphical display also illustrated basic tendency, distribution, and group information at a glance. Such an overview is necessary for gaining a better understanding of how to apply further data mining techniques.
Clustering algorithms were used to categorize students into homogeneous groups. K-means clustering techniques were applied to group students based on their shared characteristics: learning preference, time, duration, frequency, and learning performance. This method was based on distance concepts among individual participants and was intended to gather individuals who were close into the same group for further analysis (Roiger and Geatz, 2003).
Association rules were applied to find non-sequential relationships among two or more variables. An example of association rules in this study would be “behavior A à behavior B, support = 32%, confidence = 80%”. Support of the association rule meant the percentage of observed events in total events. Therefore, the aforementioned association rule means that among all analyzed events, 32% of them included behavior A and behavior B. Confidence of association rule "behavior B given behavior A" was a measure of how likely it was that behavior B would occur when behavior A occurred. Statisticians refer to this as the conditional probability of B given A. When behavior A was observed, 80% of the time behavior B was also evident. Sequential association techniques were applied in the study to find out sequential relationships among learning behaviors in order to construct learning patterns and preferences.
The decision tree is a predictive model. It works as a classifier to classify instances by sorting them down the tree from the root to leaf nodes (Quinlan, 1986). In the tree structures, leaf nodes represent classifications and branches represent conjunctions of features that lead to different target values. The study applied decision tree techniques to build a predictive model for online learning performance.
Results
Descriptive analysis: An overview
Descriptive statistics of data collected from the LMS were used to analyze participants’ login frequency, frequency of accessing course materials, number of messages posted, number of messages read, and number of synchronous discussions attended. As indicated in Table 2, the distributions of login frequency and frequency of accessing course materials were close to a normal distribution. The distributions of asynchronous communications (i.e., number of messages posted and messages read) and synchronous communications (i.e., number of synchronous discussions attended) were all skewed to the positive. The data and distributions revealed that the most common online learning activities in this case were logging into the LMS and accessing course materials. Students tended to access course materials more often than they interacted with the instructor or their peers online.
Table 2 shows that the number of posted messages (M = 30.13, SD = 29.96) and the number of messages read (M = 44.21, SD = 38.08) were significantly more than the frequency of synchronous discussion (M = 2.35, SD = 3.46), t(97) = 9.11, p < 0.000; t(97) = 11.14, p < 0.000, accordingly. Thus the asynchronous communication tool was utilized more often as the main communication method in this study. Moreover, students tended to read messages (M = 44.21, SD = 38.08) rather than post messages (M = 30.13, SD = 29.96), t(97) = 3.48, p < 0.001.
Focusing on the most common learning activities in this study, a 3D plot (Figure 2) was generated to illustrate the relationships among the following variables: total number of bulletin board messages posted (NP), total number of messages read (NR), and total frequency of accessing course materials (FAC). The results revealed that a small group of the students had a low frequency of accessing course materials, a low number of messages posted, and a low number of messages read. However, most of the students’ patterns were scattered in the graphic. The results revealed again that students would rather read messages than post messages, as most of the plots gathered to the side of total frequency of accessing course materials (FAC) and total number of messages read (NR).
To understand participants’ typical working schedules in this course, weekly login records (N=3,395) were retrieved from the original server logs by SQL and analyzed. The deadline of weekly sub-projects was midnight Monday, every week in the 6-week timeframe.
Table 2. Basic Statistics of Major Learning Behavior Variables
|
N |
Mean |
SD |
Skewness |
Total frequency of LMS logins |
98 |
33.56 |
19.28 |
0.60 |
Total frequency of accessing course materials |
98 |
34.76 |
19.06 |
0.43 |
Total number of bulletin board messages posted |
98 |
30.13 |
29.96 |
1.85 |
Total number of bulletin board messages read |
98 |
44.21 |
38.08 |
1.06 |
Total number of synchronous discussions attended |
98 |
2.35 |
3.46 |
2.91 |
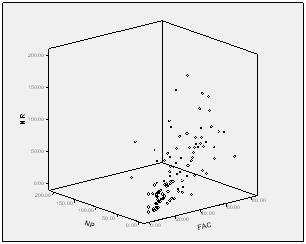
Figure 2. 3D Scatters of Total Number of Bulletin Board Messages Read (NR), Total Frequency of Accessing Course Materials (FAC), and Total Number of Bulletin Board Messages Posted (NP)
Table 3 shows that over a quarter (25.7%) of the login events happened on Tuesday, the starting day of each weekly sub-project. Over half of the login events (56%) happened on Monday, Wednesday, Thursday, and Sunday. Friday and Saturday included only minimum login events (18.3%). Table 4 illustrates that students made the most login frequencies in the first week (22.9%) when they had just started on this six-week project and the last week (18.1%) when they were wrapping up for the final submissions at the end of the project. These two weeks represent a total of 41% of log in frequencies.
Classification of students’ characteristics
Clustering techniques were applied to classify students based on their shared characteristics. The goal of clustering is descriptive rather than predictive. This study utilized six variables: total number of LMS logins, total frequency of accessing course materials, total number of messages posted, total number of messages read, total number of synchronous discussions attended, and the final grade to describe and classify the characteristics of students. The results are reported in Table 5 below.
As shown in Table 5, the students were classified into three clusters, with 29, 7, and 62 students in clusters 1, 2, and 3, respectively. Cluster 1 and cluster 2 represented the students with above-average performance. The 36 students in Clusters 1 and 2 showed greater values in all behavioral variables than the overall average. Students in Cluster 2 achieved the highest grade among the three clusters. However, these seven students read and posted fewer messages than those in the cluster 1. The results implied these seven students learned more effectively than the other students. Students in cluster 3 were below average in all behavioral variables and were thus identified as having a lower participation level in the study. Additional clustering analysis was conducted within Cluster 3 to identify the characteristics of students in this cluster. As shown in Table 6, these students were classified into two sub-clusters: Cluster 3-1 with 44 students performed better in all six variables than the Cluster 3 average, and Cluster 3-2 with 18 students who were at-risk as they rarely attended the online activities.
Table 3. Comparison of Login Data by Day
|
Percent |
Sun |
12.3% |
Mon |
14.6% |
Tue |
25.7% |
Wed |
12.9% |
Thu |
16.2% |
Fri |
9.3% |
Sat |
9.0% |
Total |
100.0% |
|
Table 4. Comparison of Login Data by Week
|
Percent |
Wk1 |
22.9% |
Wk2 |
14.3% |
Wk3 |
15.5% |
Wk4 |
14.6% |
Wk5 |
14.6% |
Wk6 |
18.1% |
Total |
100.0% |
|
Table 5. Means for Clustering Results
|
Cluster 1
N=29 |
Cluster 2
N=7 |
Cluster 3
N=62 |
Overall
N=98 |
Total number of LMS logins |
50.83 |
49.86 |
23.65 |
33.56 |
Total frequency of accessing course materials |
53.48 |
51.86 |
24.06 |
34.76 |
Total number of bulletin board messages posted |
57.04 |
40.71 |
16.35 |
30.13 |
Total number of bulletin board messages read |
91.86 |
24.86 |
24.11 |
44.21 |
Total number of synchronous discussions attended |
3.97 |
2.00 |
1.63 |
2.35 |
Final grade |
83.13 |
87.13 |
63.32 |
70.60 |
Table 6. Means for Re-clustering Results of Poor-Performing Students
|
Cluster 3-1
N=44 |
Cluster 3-2
N=18 |
Cluster 3
N=62 |
Login frequency |
31.60 |
4.23 |
23.65 |
Frequency of accessing course materials |
32.45 |
3.56 |
24.06 |
Number of messages posted |
20.42 |
6.40 |
16.35 |
Number of messages read |
31.05 |
7.17 |
24.11 |
Frequency of synchronous discussion attended |
2.00 |
0.72 |
1.63 |
Final grade |
71.18 |
44.11 |
63.32 |
Daily learning patterns
Sequential association rules were applied to discover the daily learning patterns of the students in the LMS . Rules 1 to 3 in Table 7 are the association rules with the highest support rate, which represent the most common daily learning patterns. For students logged into the LMS daily, Rule 1 indicates that more than 50% of the learning activities were simply reading the course materials (access course materials) and checking course announcements and personal records (Goto student environment). Rule 3 shows that once the students accessed the course materials, there was a 57.59% probability they would access the course materials again. Rule 4 shows that 26.53% of the students logged into LMS twice per day. Once students logged into LMS , there was a 46.67% possibility they would log in one more time. Rule 5 shows that 40.28% of the participants would post messages on the bulletin board if they accessed the course materials. Only 20.69% of the students posted more than one message (Rule 6). However, once students posted a message, there was over a 70% possibility they would post again on the same day (Rules 6 and 7).
Table 7. Conclusion of Association Rules
Rule |
Support (%) |
Confidence (%) |
- Goto student environment => Access course materials
|
57.06 |
90.14 |
- Login success => Access course materials
|
40.15 |
70.65 |
- Access course materials => access course materials
|
34.05 |
57.59 |
- Login success => login success
|
26.53 |
46.67 |
- Goto Class environment => Post on the discussion board
|
30.24 |
40.28 |
- Post on the discussion board => Post on the discussion board
|
20.69 |
73.46 |
- Post on the discussion board => Post on the discussion board => Post on the discussion board
|
16.04 |
77.53 |
Predictive analysis
Student performance predictive model
Figure 3 shows the performance predictive model using the decision tree analysis. According to the predictive model, the frequency of accessing course materials was the most important variable for performance prediction in this study. In the right part of Figure 3, it shows that when students accessed course materials more than 18.5 times in the six weeks, they had an average grade of 77.92. If students accessed course materials more than 44.5 times, the average grade improved to 89.62. The number of messages read was another important predictive variable. If students read more than 66.5 messages, their grade would improve to 88 from the average of 72.57. In conclusion, when students participated more actively (i.e. having a higher value on frequency of accessing course materials, number of messages posted, number of messages read, and frequency of synchronous discussions attended), they performed better academically.
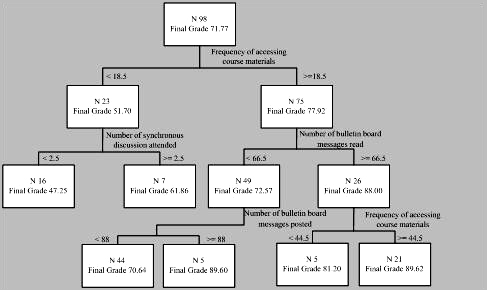
Figure 3. Decision Tree for Performance Prediction
Discussion
The discussion below focuses on two perspectives: one is the practical implications of online teaching and learning, and the other is the power and potential of educational data mining. In this study, students’ participation levels were depicted through various data analyses. The results showed that the majority of the students were passive, with most of their online learning activities being reading or accessing the course materials. Even though the course was constructed with a heavy emphasis on peer collaboration with clear structure and sufficient guidelines, students were not actively seeking collaborations as indicated in their online learning behaviors. They would read course materials provided by the instructor online, but did not always post, read or respond to messages in online discussions.
However, the decision tree analysis clearly showed that active participation in the online discussions, such as posting and responding to messages, was more important in predicting students’ performance than simply reading learning materials. As educational researchers and educators have long realized, in online learning environments learners have to be more independent and interdependent, instead of counting on the instructor as the knowledge giver (by passively reading course materials online). As this study was conducted in an online projected-based learning (PBL) environment, collaborations were critical in the problem-solving process and the quality of the outcomes. The clustering results categorized students into three clusters with different levels of participation and academic performance. These results may help an instructor better understand students’ learning characteristics and identify at-risk students (e.g., Cluster 3-2).
With DM techniques, an instructor may collect and analyze data anytime during an online course. It enables an instructor to track each student’s learning progress in a timely manner and to provide dynamic feedback or to facilitate intervention as needed. This makes adaptive learning or personalized, customized learning available in the online environment. With the increasing size of online classes, data mining techniques enable online instructors to monitor more efficiently and to identify at-risk students sooner. Combining clustering and decision tree results, we may confidently predict that those students with low levels of participation and low achievements could achieve better performance, if the instructor could strategically promote their participation in online discussions.
The variable identification not only provides observation parameters but also leads to the construction of a predictive model, which enables instructors to predict student’s learning performance through real-time data mining analysis. For example, instructors may build a predictive model with data collected in the first week of the semester, and then be able to identify the frequency of online discussion as a very important factor for improving learning outcomes. The instructor may then adjust his/her facilitation or management strategies accordingly. Through data mining techniques, instructors can identify students’ learning behaviors and patterns, but more importantly, they may build, test and apply predictive models for just-in-time teaching (e.g., Novak et al., 1999), adaptive learning and assessment, and customized activities and strategies to improve online learning. In different learning environments or for different subject areas, the predictive variable may well be different from accessing course materials. Whatever it might be, if the instructors can use data mining to identify important learning behaviors and provide appropriate support to promote these behaviors earlier, then learning can be enhanced.
Login event analysis revealed that participants usually login on the first day of each sub-project to find out the details of the tasks and requirements. They usually worked on the project the last two days and normally did not work on Fridays or Saturdays. The findings provide some insights for instructors to better schedule assignment deadlines, to facilitate the student online activities as well as to better adjust their own teaching schedule as necessary. Therefore, for these participants, vocational-track undergraduate students in Taiwan , or similar online students, having projects due on Mondays is probably not the best strategy, as they may not use the weekend to work on the course as instructors would hope. Knowing students’ preferred learning days and times in an online course, an instructor may schedule strategically to promote learner engagement.
The analysis also revealed that the highest login frequency happened in the first week during the 6-week time frame. Therefore, instructors may need to invest more time and efforts at the beginning to facilitate and guide the learning process, especially in a PBL or a similar learning environment, where more scaffolding is needed at the beginning. The peak login frequency in the final week was well expected as students needed to integrate all sub-projects from previous weeks into a comprehensive final project. The above analysis processes could also be applied to build other predictive models to ensure high retention rate, as well as active and effective online learning. In addition, data mining techniques can be used to identify at-risk students, successful and less-successful learning patterns in online learning, and shows great potential to help online educators in multiple ways.
Conclusion
Generally speaking, data mining techniques are powerful tools for discovering hidden knowledge, and have great potential to reveal online learning behavioral patterns, preferences, progress, and more. However, current educational data mining tools such as TADA-Ed (Merceron & Yacef, 2005) are not educator-friendly. More easy-to-apply, educator-friendly DM tools are in demand.
In current popular LMS , instructors would be able to get a quick view of basic learning data, such as login date, frequency, pages visited, etc. However, no functions or features are currently available to help instructors identify learners’ individual or group learning patterns, or to identify successful or less-successful learning behavioral patterns, or to identify the predictive learning behaviors or to help identify necessary facilitation needs. Therefore, the researchers of this study strongly suggest that LMS developers should integrate data mining tools to facilitate effective online teaching and learning.
Future research needs to be focused on validating the predictive model by applying it to other online learning environments.
References
Becker, K. Vanzin, M. Marquardt, C & Ruiz, D (2006) Applying web usage mining for the analysis of behavior in web-based learning environments. In Romero, C & Ventura, S. (Eds.), Data Mining in E-Learning (pp. 117-137). Billerica , MA : WitPress.
Chen, G.D., Liu, C.C., Ou, K.L. & Liu, B.J. (2000). Discovering decision knowledge from web log portfolio for managing classroom processes by applying decision tree and data cube technology. Journal of Educational Computing Research, 23(3) 305-332.
Chen, L.D., Sakaguchi, T. & Frolick, M. N. (2000) Data mining methods, applications, and tools, Information systems management, 17(1), 65-70
Fichter, D. (2003). "Server Logs: Making Sense of the Cyber Tracks," ONLINE 27 (5) 4755
Government Information Office. (2004). Taiwan yearbook 2004. Retrieved May 8, 2005 , from the official Government Information Web site at http://www.gio.gov.tw/taiwan-website/5-gp/yearbook/P269.htm
Konstanz University (2006), Konstanz Information Miner. Retrieved December 20, 2007 , from Knime official web site at http://www.knime.org/index.html
Hastie, T., Tibshirani, R., & Friedman, J. H. (2003). The Elements of Statistical Learning. 3rd ed. New York , NY : Sringer
Hsu, C.S., Tu, S.F. & Hwang G.J. (1998) A concept inherit method for learning diagnosis of a network-based testing and evaluation system. International Conference on Computer-Assisted instructions, 602-609
Hwang, G. J. (2003). A conceptual map model for developing intelligent tutoring system. Computers and Education, 40(3), 217-235.
Hwang, Y. M., Chen, J. N., Cheng, S. C. (2007). A method of cross-level frequent pattern mining for web-based instruction. Educational Technology& Society, 10(3), 305-319.
Maimon, O., & Rokach, D (2005). Data mining and knowledge discovery handbook. O. Maimon & L. Rokach (Eds.). New York : Springer Science+Business Media.
Marjamaa, J. (2003) Managing Your Customer Resources Through Data Mining, Community Banker, 12(4), 28-30
Merceron, A. & Yacef, K. (2005). TADA-Ed for Educational Data Mining, Interactive Multimedia Electronic Journal of Computer-Enhanced Learning, 7(1), May 2005. http://imej.wfu.edu/articles/2005/1/03/index.asp.
Merceron, A. & Yacef , K. (2005). Educational Data Mining: a Case Study, in proceeding of the conference on Artificial Intelligence in Education (AIED2005). Amsterdam , The Netherlands , 2005.
Mor, Minguillon & Carbo (2006) Analysis of user navigational behavior for e-learning personalization. In Romero, C & Ventura, S. (Eds.), Data Mining in E-Learning (pp. 227-246). Billerica , MA : WitPress.
Nanjiani, N.A., Kelly, T., & Kelly, T.M. (2004). The Business Case for E-Learning. Cisco Press
Neuhauser, C. (2002), Learning Style and Effectiveness of Online and Face-to-Face Instruction. American Journal of Distance Education 16(2), 99-113.
Novak, J. D. (1998). Learning, creating, and using knowledge: Concept maps as facilitative tools in schools and corporations. Mahwah , NJ : Lawrence Erlbaum Associates.
Novak, G. M., Gavrin, A. D., Christian, W., & Patterson, E.T. (1999). Just in Time Teaching: Blending Active Learning with Web Technology. Prentice Hall.
Quinlan, J. R. (1986). Induction of decision trees. Machine Learning 1(1), 81-106.
Roiger, R.J. & Geatz, M.W. (2003). Data Mining - A Tutorial-Based Primer. Addison Wesley, Pearson Education Inc.
Su, J. H., Tseng, S. S., Wang, W., Weng, J. F., Yang, J. T. D. & Tsai, W. N. (2006). Learning portfolio analysis and mining for SCORM compliant environment. Educational Technology & Society, 9(1), 262-275
Tseng, S.T., Tsai, S.M., Su, T.H., Tseng, CH.L. & Wang CH.I. (2005). Data Mining. Taipei , Taiwan : Flag publishing
Wang, J. (2003). Data Mining: Opportunities and Challenges. Hershey , PA : Idea Group
Winters, T. (2006). Educational Data Mining: Collection and Analysis of Score Matrices for Outcomes-Based Assessment. Ph.D. Dissertation, University of California Riverside
Witten , I. H. & Frank, E. (2005) Data Mining: Practical machine learning tools and techniques, (2nd ed.), San Francisco : Morgan Kaufmann.
Zaiane, O. R., Luo, J. (2001), Towards evaluating learners' behavior in a web-based distance learning environment, in Proc. of IEEE International Conference on Advanced Learning Technologies (ICALT01), 357-360, Madison, WI, August 6-8, 2001.
Zaiane, O.R., Xin, M., Han, J. (1998), Discovering Web Access Patterns and Trends by Applying OLAP and Data Mining Technology on Web Logs, in Proceeding. ADL'98 (Advances in Digital Libraries), Santa Barbara , April 1998.
Zhang, K., & Hung, J. (2006). E-learning in Taiwan : Policies, practices, and problems. International Journal of Information and Communication Technology Education, 2(1), 37-52.
|