|
Patterns of User Activity in the Different Features of the Blackboard CMS across
All Courses for an Academic Year at Brigham Young University
Michael E. Griffiths
Center for Teaching and Learning
Brigham Young University
Provo, UT 84602 USA
mike.griffiths@byu.edu
Charles R. Graham
Associate Professor
Department of Instructional Psychology and Technology
Brigham Young University
Provo, UT 84602 USA
charles_graham@byu.edu
Abstract
In the past decade, course management systems (CMS) have become an integral part of most institutions of higher education. While there has been a significant amount of research looking at CMS usage at the course level, there has been less research looking at institution-wide CMS usage from a CMS activity database perspective. This article shares findings from a study which analyzes over 36 million student and instructor clicks within the Blackboard CMS across the entire campus of Brigham Young University (BYU) during one full academic year. This research reports overall levels of user activity across campus, patterns of user activity in the different features of Blackboard, and patterns of user activity in the different features of Blackboard within different colleges. The study compares the levels of activity for Blackboard CMS features that are predominantly pedagogical verses predominately administrative in nature.
Keywords course management system,learning management system, LMS, blackboard, student learning, impact, ROI
|
Introduction
The need to understand how Course Management Systems (CMS) are being used and how they are affecting teaching has become a high priority for many institutions. This need is in part motivated by the rapid propagation of these systems. In 2001, The Campus Computing Project reported that 75% of colleges that participated in the study had already established a “single product” standard for their CMS (Green, 2001). Blackboard became the number one producer of CMS in the nation when it purchased WebCT, and is estimated to control 80%-90% of the CMS market (Roach, 2006). Implementing a CMS such as Blackboard at an institution of higher education requires a substantial level of investment and administrators naturally want to know the impact on the quality of student learning. The valuing of CMS is especially difficult and requires new evaluation and measurement methods as they have so far been notoriously difficult to evaluate (Mott & Granata, 2006). Many studies have attempted to analyze the impact of CMS in individual course-sections, however, there has been very little data gathered that describes the usage of a CMS across a whole institution.
Administrators and leaders are interested in the big picture rather than isolated instances of CMS usage. High-level questions that can be asked include: How is the CMS actually being used, and is it mostly used for administrative or pedagogical purposes? These general questions may be viewed in many different ways, one of which is to view the CMS in terms of the features that are available. In terms of features, the questions can be re-phrased as: How much is each feature in the CMS being used and how much are the administrative features being used as opposed to how much are the pedagogical features being used? It is not possible to know how each professor intends to use the different features of Blackboard, but some features seem to be more administrative in nature, such as grades and announcements, while others seem to be more pedagogical in nature, such as quizzes and discussion boards. For the purpose of this study, features in the Blackboard CMS are described as administrative or pedagogical based on their most obvious function as described in the methods section.
The Need for Data
To answer high-level CMS usage questions requires a study of a dataset that incorporates many, or all course-sections at an institution of higher education rather than just a small sample. This kind of large-scale data driven study has so far been lacking in the domain of CMS research. West, Graham, Waddoups, and Kennedy (2007) conducted a search of several of the major databases in the fall of 2005 and found 164 published articles that mentioned course management systems. Of these articles, only 74 appeared to be data-driven articles and most of these were quick evaluations of how a CMS impacted a particular class or context. According to West, et al. (2007), less than 10 studies seemed to attempt a more general evaluation of the impact from using a CMS over multiple contexts, such as multiple university departments.
One example of a study that attempted to quantify an element of actual usage of a CMS across an institution was performed at the Tel-Aviv University’s School of Education in Israel for the 2002-2003 academic year (Nachmias, Ram, Mioduser, 2005). In this study, course web sites were analyzed in respect to the types of pedagogical content and how often the content was accessed. The study showed some interesting patterns pertaining to content access, such as 62% of students viewed at least one content item, but 38% of students viewed no content at all. Observations of this nature required the gathering of statistics from a large number of courses at the institution. BYU provides an ideal case for a campus wide study as, according to Blackboard, BYU is one of their top 5 hosted users (personal communication, April 27, 2007). Consequently, in coordination with Blackboard, researchers at BYU were able to extract activity data for all users in the Blackboard system at BYU for the 2004-2005 academic year.
CMS Activity for a Full Academic Year at BYU
This study is based on activity data extracted from the Blackboard CMS for every course-section that used Blackboard in 2004-2005 at BYU. The study aims to give some answers to the high level questions by creating a campus-wide dataset and describing some of the patterns of how Blackboard is being used in terms of student and professor activity recorded in the Blackboard database. The resulting dataset and description of patterns is useful as a tool for interpreting the overall use of Blackboard and also as a platform for more detailed research into specific areas. The research questions address the general questions about how Blackboard is being used at BYU in terms of overall activity, overall feature usage, and feature usage in different colleges.
Methods
The Blackboard database is stored in an Oracle database and information is stored in various database tables each time that a user clicks on any available links/buttons in the Blackboard system. When a click is performed by a user, information about the click is stored in a database table as a new record (or row). For example, when a student clicks on announcements in Blackboard, a record is created in the activity database showing that a click on announcements had been performed by a certain student in a certain course-section.
For this study, records from the Blackboard database were extracted for all clicks performed by students and instructors in the Blackboard system for 2004-2005 (fall 2004, winter 2005, spring 2005 and summer 2005). Blackboard activity was summarized into course-section level statistics. For every course-section, total clicks (activity) performed by students and instructors were summarized by the following feature categories: Announcements, Communication , Discussion Board, Dropbox, Group Collaboration, Grades, Quiz, Content Folder, Content, Course Roster, Course Tools, Staff Info, and Other. The Communication category represents clicks classified by the Blackboard database as course communications or course emails.
In order to compare activity levels across large and small enrollment course-sections, the activity data were normalized by replacing actual clicks with average clicks per user type. This campus-wide data were analyzed to find general patterns of feature activity. The report describes results and discussion for the following sets of analysis questions.
- What is the overall level Blackboard activity across the whole campus?
- What is the overall level of activity in each Blackboard feature category?
- What is the overall level of activity in each Blackboard feature category within colleges?
Results
Overall Blackboard User Activity
According to the Registration Department at BYU there were 11,809 course-sections that could potentially use Blackboard (personal communication, May 9, 2007). The number of Blackboard course-sections that have at least some student activity was 6,467 out of an approximate potential of 11,809 course-sections, which is 55%. Of the 6,467 course-sections only 14 were online courses. All the other course-sections were face-to-face courses where Blackboard was used to assist or enhance instruction. Of the 6,467 course-sections that used Blackboard, a total of 36,080,401 clicks were performed in the Blackboard system with an average of 91 clicks per user per course-section. Griffiths (2007) reported BYU to be one of the Blackboard ASP’s top five most active clients.
A closer analysis of overall activity shows that students perform an average (mean) of 85 clicks per course with a standard deviation of 12, and instructors (professors and teaching assistants) perform an average (mean) of 247 clicks per course with a standard deviation of 25. There are some courses that have high levels of average clicks per student, but Figure 1 shows that over 90% of courses have average student clicks of 175 or fewer, 75% of all courses have average student clicks of 85 or fewer, and 50% of all courses have average student clicks of 35 or fewer. With 75% of classes having average student clicks of 85 or fewer, during a 15 week semester that equals fewer than 6 clicks per student per week respectively. Because data was collected at the course level rather than the individual student level, we were unable to determine how much individual student use deviated from the course mean. For example, it would be interesting to know if courses are structured so that a few highly motivated students are benefiting from the CMS while most of the others are not using it at all.
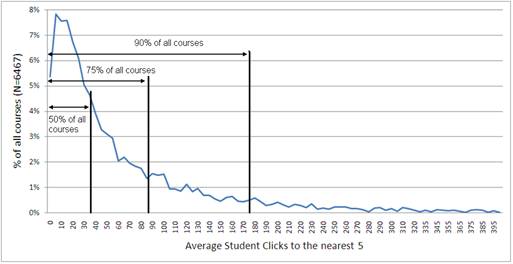
Figure 1. Average student clicks as a percentage of all courses. This shows that 35%
of all courses had average student clicks of 35 or less.
These results suggest that although more than half of all course-sections at BYU used Blackboard in 2004-2005, most of those course-sections had a low level of student and instructor activity. One recommendation arising from this study is that the small percentage of course-sections that have high average student clicks should be studied in more detail to discover what is different about those course-sections, or in what manner the high activity impacts student learning.
Blackboard User Activity by Feature
All activity (clicks) was grouped into 12 features which are shown in Figure 2. One other feature, titled Content Folder in the Blackboard database is omitted from data cited in this report. Content Folder is not an actual feature, but represents clicks on a folder which are purely navigational and for this reason they are not included in the report. This is only mentioned as Content Folder had by far the highest level of activity in the Blackboard database for both students and instructors. Figure 2 shows student clicks and instructor clicks in the 12 remaining feature as a percentage of all student and instructor clicks.
For students, the largest group of clicks shown on Figure 2 is in the Announcements feature with 35% of all student activity which equates to nearly 7 million clicks. Content, which represents documents, links to web pages, and lesson pages, is the next highest used feature. Announcements, Content, Grades, Quiz, Discussion Board, and Communication account for 90% of all student feature activity. Approximately 50% of student activity is in the administrative features of Announcements, Grades, and Communication. Therefore, half of all student activity is in features that are considered to be pedagogical in nature. From an educational perspective, it is encouraging that Content, Quiz, and Discussion Board clicks were used by students more than Grades and Communication and that only half of all student activity appears to be administrative.
Figure 2 shows that instructors performed most of their clicks in Blackboard in Content, Announcements, Discussion Board and Grades. Grades is the highest clicked feature for instructors with almost 60% of instructor clicks, which equates to around 1.5 million clicks. Communication, Announcements, Discussion Board, Content, Quiz, and Group Collaboration account for another 36% of all instructor clicks. Grades, Communication and Announcements are considered to be administrative features and they account for approximately 78% of instructor activity. This suggests that instructors use Blackboard mostly as an administrative tool. However, it is impossible to know the objectives of individual instructors in their use of Blackboard, and it is recommended that the use of each feature be studied individually in more detail before any conclusions can be made.
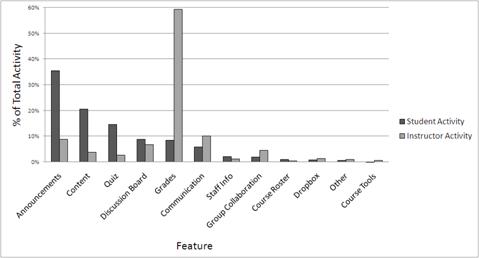
Figure 2. Student and Instructor activity in different features as a percentage of total activity.
Blackboard User Activity for Each Feature in Different Colleges
In this section, student activity in Blackboard features is analyzed by comparing student activity in the six most used features in the different colleges at BYU. The top three administrative features are Announcements, Grades, and Communication. The top three pedagogical features are Content, Quiz, and Discussion Board. Student activity in the administrative features is shown on Figure 3, and student activity in the pedagogical features is shown on Figure 4. The acronyms for colleges on Figures 3 and 4 represent the college of Biology and Agriculture, Business, Education, Engineering and Technology, Family, Home and Social Science, Fine Art and Communication, Health and Human Performance, Humanities, Physical and Mathematical Science, and Religion.
Figure 3 shows that the percentage of Student Clicks in each administrative feature is fairly similar in all colleges apart from the Communication feature which has slightly more variability. This pattern suggests that each college uses the administrative features of Blackboard in a similar way. Figure 4 shows that the percentage of Student Clicks in each pedagogical feature is highly variable across all colleges with different colleges seemingly having a preference for certain pedagogical features. For example, the college of Education has over 20% of all their Student Clicks being performed in the Discussion Board compared with the College of Business and the College of Physical and Mathematical Sciences which have around 1% of all their Student Clicks being performed in the Discussion Board feature.
The variability across colleges in the use of pedagogical features of Blackboard is an interesting aspect that has surfaced in this study. It seems that colleges have favorite educational methods that equate to certain features of Blackboard. Some colleges, such as the college of Education heavily use the Discussion Board, some colleges such as the college of Physical and Mathematical Science heavily use Quiz, and others such as the college of Biology and Agriculture heavily use Content.
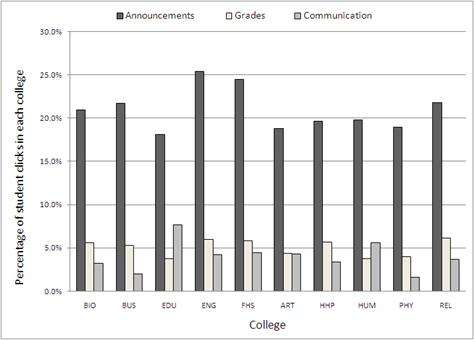
Figure 3. Percentage of student clicks in administrative features of Blackboard
shown in each college.
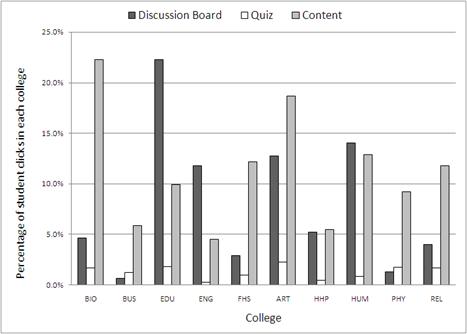
Figure 4. Percentage of student clicks in pedagogical features of Blackboard
shown in each college.
Discussion
The results of this study have shown some patterns of Blackboard feature activity, each will require an in depth study to be able to move towards an understanding of any implications to the overall education process. This section of the study summarizes some interesting aspects of the discovered patterns and offers suggestions of areas that require further study.
Overall Levels of Activity
Although BYU is one of the heaviest users of Blackboard, the average activity within the course-sections that used Blackboard in 2004-2005 seems to be quite low. The mean of average student clicks in a course-section is only 85 clicks with a standard deviation of 12, and only 10% of classes have average student clicks of over 175. Over the span of a semester, 85 clicks would not appear to equate to a heavy use of a CMS, but this study cannot determine the pedagogical benefit of the Blackboard activity. It is possible that even a low level of activity that is well directed can equate to an improved learning experience. It is also possible that such a low level of activity has no positive impact on learning at all, which may raise question about the overall benefits and the return on investment of a campus wide CMS. Further research is recommended in both courses that have low levels of student activity to determine the value of such activity, and also in courses with very high levels of student activity to determine what is different and what is gained by such levels.
The Most Used Features in Blackboard
The features of Announcements, Content, Grades, Quiz, Discussion Board, and Communication constituted approximately 90% of all activity in Blackboard for 2004-2005. The fact that the top six features account for 90% of all activity could lead to many possible conclusions and further questions. This may show that to be a successful product, a CMS only needs to incorporate these most used features. It could also be the case that some features that are not used to any substantial degree may in fact be useful, but have not yet been discovered by enough faculty members, or that training has not been given in these features, or that the feature could be useful but is too difficult to use. The other features that constitute 10% of all activity should be studied to see what potential for educational benefits exists in using these features, and what training could be given to instructors for useful features that have not so far been discovered and used to any significant degree.
Blackboard Feature Usage Variance in Different Colleges
An interesting pattern of activity relating to features was found when comparing the activity level in different features across different colleges. Features that were categorized as administrative features in this study had fairly comparable levels of activity in all colleges which suggests that there is a typical way of using those features that may not vary significantly between colleges. However, there is a large variance of levels of activity between colleges for the features that were categorized as pedagogical. It would seem that colleges have favorite educational methodsthat equate to certain features of Blackboard.
Some colleges heavily use Discussion Board, some colleges heavily use Quiz, and others heavily use Content. It may be that colleges have adapted teaching methods over time that have now translated into the way that they use Blackboard, or it may be the case that the colleges have evolved these methods through their use of Blackboard since it was implemented. Different instructional philosophies or strategies in colleges appear to be suggested by the data from Blackboard. It may also be that certain traditions of using Blackboard have appeared in each college through the example of faculty who pioneered the use of the CMS. Other faculty may have copied these approaches creating a perpetuated tradition of usage style in each college. Further research is recommended to study the relationship between activity levels of pedagogical features and the teaching methods that prevail in different colleges.
Conclusion
The patterns summarized in this article give a certain level of information from an overview perspective that can be used for high level discussion purposes, for future research recommendations, and as a baseline set of statistics that can be used to compare against future studies of this nature. This high level CMS activity analysis can also inform and generate research questions for the more in depth studies of individual courses. Although the high level view of CMS activity reported in this study cannot generate any firm conclusions about student learning, the patterns shown at this level are useful for directing and informing the detailed case studies of student and instructor use of a CMS. It is impossible, for example, to know the intentions and pedagogical methods employed by instructors of all class sections who use Blackboard, and a detailed observation and analysis of just a few class sections would be of little use in the context of the analysis of campus wide activity data.
Though precise conclusions cannot be made without a more detailed level of analysis, there are some possible implications discussed in this study. The analysis of feature usage, which shows that the top six features account for 90% of all activity, may suggest that there is a need to improve the faculty training for the less used features of the CMS. It may also be found that the less used features are more difficult to implementand require some revision by the CMS producers. The high variation in the use of the pedagogical features in different colleges may
suggest that faculty in different colleges need more training in how to use other pedagogical features that may also be useful to their discipline.
To generate more precise conclusions, research that is based on patterns discussed in this study should be conducted at a more detailed level where student level data are available rather than course-section level data. Research of data at student level that is informed by the results of this study is recommended so that variances and standard deviations within course-sections can be analyzed and detailed patterns of student activity can lead to a greater understanding of student learning strategies and habits. This level of research will produce a detailed set of results that could potentially lead to the shaping of the use of Blackboard and other CMS to maximize the educational benefits to students. Further research is also needed to answer the overall question of measuring the benefit of a CMS at an institution of higher education.
References
Green, K. C. (2001). Campus Computing Project. Retrieved April 9, 2007, from http://www.campuscomputing.net
Griffiths, M. (2007). Patterns of User Activity in the Blackboard Course Management System Across All Courses in the 2004-2005 Academic Year at Brigham Young University. Retrieved January 3, 2008 from http://contentdm.lib.byu.edu/u?/ETD,1028
Moersch, C. (1995). Levels of Technology Implementation (LoTi): A Framework for Measuring Classroom Technology Use. Learning and Leading with Technology, 23(3) p40-42.
Mott, J., & Granata, G. (2006). The Value of Teaching and Learning Technology: Beyond ROI. Educause Quarterly.
Nachmias, R., Ram, J., Mioduser, D. (2005). The study of a campus wide implementation of blended learning in Tel Aviv. In C. J. Bonk, C. R. Graham (Eds.). The Handbook of Blended Learning: Global Perspectives, Local Designs (pp. 374-386). San Francisco, CA: Pfeiffer.
West, R., Graham, C., Waddoups, G., & Kennedy, M. (2007). Weighing Costs Versus Benefits: Evaluating the Impact from Implementing a Course Management System [Electronic Version]. International Journal of Instructional Technology and Distance Learning, 4. Retrieved April 4, 2007 from http://www.idtl.org/Journal/Feb_07/article01.htm.
|