Introduction
It has been suggested that statistics may be one of the most demanding and rigorous courses taken during a program of study, consequently evoking cognitive and emotional reactions that may inhibit a student’s level of performance (Zeidner, 1991). Previous research has also suggested that one aspect of a statistics course that induces anxiety is the use of statistical software (DeVaney, 2006). In a traditional setting in which a student attends a weekly lab, students can be guided through the use of software by an instructor or assistant. However, when a statistics course is delivered online, the students are often required to learn the software on their own using resources that are included in textbooks and manuals. These resources often consist of step-by-step instructions accompanied by selected screen shots of the software. However, the results of research by Gellevij, van der Meij, de Jong, and Pieters (1999) and van der Meij (2002) were not conclusive regarding the effect of including screen captures or the design layout of the manuals.
The inconclusive results regarding the effectiveness of hardcopy training manuals may be explained by Paivio’s dual-coding theory (Clark & Paivio, 1991; Reed, 2006) and Baddeley’s model of working memory (Baddeley, 1992, 2003; Reed, 2006) which both proposed the existence of two channels for processing information. Paivio focused on the presence of verbal (spoken and read words) and non-verbal (pictures) channels, and Baddeley identified visual (text, pictures, etc.) and audio (sounds) channels. Despite differences in the nature of the channels, both approaches suggest that information enters working memory through the eyes and/or ears. In addition to discussing two systems for processing information, Baddeley discussed the limited capacity of working memory. This is particularly relevant to Sweller’s cognitive load theory (Reed, 2006; Sweller & Chandler, 1994) which proposed the possibility of overloading the cognitive demands of the working memory. Based on these theories, all of the information contained in traditional hardcopy manuals must be processed through a single channel. Consequently, the high cognitive load placed on the single channel can limit the effectiveness of the manual.
In 2001, Mayer proposed a theory of multimedia learning based on three assumptions: (a) the use of dual-channels for processing information, (b) limited capacity within working memory to process information in each channel, and (c) active processing. The dual-channel assumption is based on Paivio’s dual-coding theory (Clark & Paivio, 1991; Reed, 2006) and Baddeley’s working memory model (Baddeley, 1992, 2003; Reed, 2006). Mayer’s theory suggests that multimedia learning allows the user to acquire information through both channels by combining visual and auditory information into a single presentation. Because Mayer’s theory suggests that each processing channel has a limited capacity, placing a high cognitive load on one channel may hinder the effectiveness of the presentation. By presenting material in a format that takes advantage of both channels, Mayer’s theory suggests that the cognitive load on each channel will be reduced and the presentation will be more effective and enhance learning.
Although Mayer (2001) defined a multimedia learning presentation as a “presentation involving words and pictures that is intended to foster learning” (p. 3), Hoffler and Leutner (2005) point out that the model does not appear to make a distinction between static pictures and animation. Therefore, they conducted a meta-analysis and concluded that animations were superior to static pictures. Additionally, representational animation (animation that depicted the content to be learned) was more effective than decorational animation when both were compared to static pictures. Finally, Hoffler and Leutner concluded that animations are more effective when they focus on procedural-motor knowledge compared to declarative knowledge.
Veronokis and Maushak (2005) applied Mayer’s theory in an examination of the impact of three instructional formats, including screen captures with audio, on the learning of computer software. The screen capture with audio presentation involved 83 slides and was delivered as a flash animation presentation that introduced basic commands. Based on the terminology used by Hoffler and Leutner (2005), the flash presentation used representational animations with a focus on procedural knowledge. The results indicated that there was no significant difference in learning among the presentation formats; however, students expressed a preference for using a multimedia presentation style.
Although the use of a multimedia approach to deliver instruction may seem desirable, faculty must be aware of the possible methods for distributing multimedia content. Technology advances during the 1990s included advances in computer networks, more powerful personal computers, and modern operating systems. These advances combined to make streaming media practical for consumers. This technology allows the end-user to view a multimedia file while it is in the process of being downloaded. Shepard (2003) examined the role of streaming media and stated that there was great interest in the technology but little research to support its use.
Researchers who have examined the effect of streaming video have focused on issues including student achievement and attitudes. Keefe (2003) examined the use of streaming lectures to enhance face-to-face classes and concluded that streaming lectures can be successfully used to prepare students for class, which can then be devoted to activities other than simply covering course material. Boster, Meyer, Roberto, Inge, and Strom (2006) and Boster, Meyer, Roberto, Lindsey, Smith, Inge, and Strom (2007) examined the effect of video streaming technology on achievement. Boster et al. (2006) found significant differences in examination performance of third and eighth-grade students, and Boster et al. (2007) reported significant differences in mathematics achievement among sixth and eighth-grade students.
In an effort to further the research related to the use of instructional videos, the current study examines the impact of a series of video tutorials that were created and used in an online statistics course. The tutorials used representational screen recordings with narration to illustrate the procedures for conducting statistical analyses using the SPSS software package.
Method
Description of Course
This research focused on the introduction of video tutorials in a master’s level introductory educational statistics course during the Spring and Summer 2008 terms. The course was part of an online degree program offered by a regional university in the southeastern United States. The course was delivered using the Blackboard course management software and included descriptive statistics, inferential statistics (e.g., t-tests, ANOVA, etc.), correlations, and selected non-parametric analyses. The requirements for the course included a series of practice problems designed to guide students through each topic and a graded assignment to be completed at the end of each topic. The course culminated with a set of problems that required the students to identify and conduct the proper analyses and a final exam. The focus of the course was on utilizing SPSS statistical analysis software to conduct the analyses rather than learning formulas and performing hand calculations.
Based on student questions and comments from prior terms, written guides regarding each analysis covered in the course had previously been created and were still available for students to use. These documents were designed to assist the student by providing detailed explanations of the steps involved in using the SPSS software. Along with the narrative explanation, the guides included screen shots to illustrate the steps (see Figure 1).
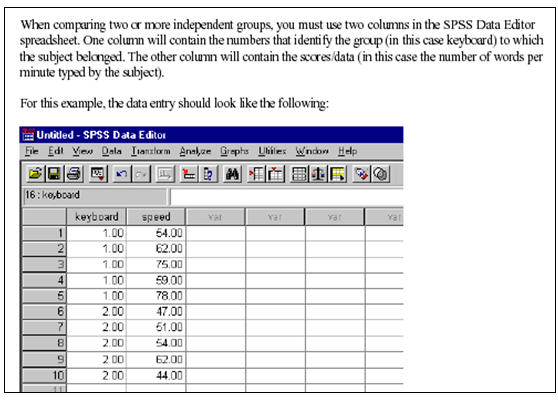
Figure 1. Excerpt from guidesheet available to students
Video Tutorials
Seventeen tutorials that ranged from 3 to 24 minutes with an average length of approximately 13.5 minutes were created. Each tutorial was recorded using Camtasia Studio 4 (TechSmith Corporation, 2007) which was able to record movement on the screen and narration that was being provided through the use of a headset microphone. Initial recordings took place in the researcher’s office; however, later recordings took place in a classroom that was equipped with a Smartboard ® and projector. Based on a comparison of file sizes and the desire to have full-screen playback, each video was produced as a Windows Media File (.wmv). Click to view a sample tutorial.
Despite the appeal of streaming video, one drawback is that the consumer must be located at a computer with Internet access in order to view the video. Fortunately, podcasting addresses this issue by allowing the consumer to automatically download available files and view them at their convenience. Therefore, the initial delivery method was patterned after the podcasting-type format which is based on an RSS (really simple syndication) feed. After installing an aggregator program (Juice, iTunes, etc.), a student would simply subscribe to the feed. The software would then look for and download the available media files automatically. Because iTunes ®, perhaps the most well-known aggregator, was not compatible with .wmv files, the Juice media aggregator (Curry & Winer, 2005) was used.
It is important to note that although a podcasting approach was originally used to disseminate the tutorials, some students reported difficulties installing the aggregator software. After troubleshooting, it was determined that the Juice software was not compatible with Microsoft’s Vista operating system which had recently been released. Consequently, a webpage that contained links to each of the tutorials was created and made available to all students. Therefore, students had two methods for accessing the tutorials. This not only allowed students who were not able to use the podcast delivery technique to view the files but also allowed students who had previously downloaded the tutorials to access them when they did not have access to the computer on which the files were saved.
Instrument
To evaluate the perceptions of the tutorials, a survey containing nine items to which students responded using a 5-point likert-type scale was distributed at the end of the Spring and Summer 2008 terms. The scale ranged from Strongly Agree (5) to Strongly Disagree (1) with a middle Neutral option. Eight of the items were positively worded; therefore, Strongly Agree was interpreted as a favorable perception and higher mean responses were interpreted as more favorable. For the remaining item, Strongly Disagree was interpreted as a favorable response; however, in order to have consistent interpretation among the means, the numerical values were reversed.
Selected information regarding demographics and Internet access was also collected. Demographic information included gender, ethnicity, age, degree program, and number of online courses completed. Questions concerning Internet access focused on the primary location (e.g., home, work, etc.) and type of access (dial-up or high speed). The survey also included two opportunities for students to provide written comments. For students who stated that they did not use the tutorials, the first opportunity allowed them to explain why they did not use the tutorials. The second opportunity allowed students to comment on their experience with the tutorials.
Results
Description of Students
A total of 78 students were enrolled in the sections that included the video tutorials during the Spring and Summer 2008 terms and all students completed the attitude survey. Table 1 shows that the majority of the students were female and the predominant ethnicity was White. The mean age of the students was 35.74 years (SD = 9.59) with a range of 22 to 60 years. With respect to the location and type of primary Internet connection, results indicated that the main Internet connection was located at home and was usually a high speed (dsl, cable, etc.) connection.
Table 1. Demographic information for respondents completing pre and post surveys (n = 78)
Demographic
|
|
Gender |
Ethnicity |
|
|
Male
|
Female
|
White
|
Black
|
Age
|
|
20.5% |
79.5% |
61.5% |
33.3% |
M = 35.74 |
SD = 9.59 |
Technology characteristics
|
Location of primary Internet connection |
|
Home |
Friends/Relatives |
Work |
Other |
|
80.8% |
2.6% |
15.4% |
1.3% |
Type of primary Internet connection
|
|
Dial-up |
High speed |
|
|
|
16.7% |
83.3% |
|
|
Additional demographic information revealed that the students were enrolled in a variety of academic programs. The most frequently reported program was School Counseling (38.5%) followed by Counseling/Psyshology (19.2%). The remaining students were enrolled in Education and Library Media programs. Students were also asked about the number of online courses that they had completed. One student reported the completion of 45 courses; however, the remaining students reported 15 or fewer courses. The fewest number was zero, and 50% of the students reported the completion of 3 to 8 courses.
Attitude Toward Tutorials
When asked how many tutorials were viewed, 65 (83.7%) students reported viewing at least one, and 31 of the 65 students reported viewing more than 10. Students who did not view any videos were given the opportunity to explain why they chose not use the tutorials. When the comments were examined, two main reasons were identified. First, some students stated that they were not necessary. For example, one student commented, “I feel as though I completed the course just fine without using them,” and another added that the “textbook and teacher notes were excellent.” One respondent summed up this reason by simply stating that he or she “didn't need it.” Although some students chose not to utilize the videos because they were able to complete the course without them, others identified technology-related concerns. One student reported “a problem with viewing vodcasts/tutorials . . . due to the fact that I had dial-up internet connection.” Another student reported that that he or she had “very little time to figure out how.”
The survey results based on the 65 students who viewed at least one tutorial are presented in Table 2. The results show an overall favorable response to the tutorials. Approximately 75% of the students reported that the tutorials were enjoyable and interesting, and 84.6% indicated that the tutorials met their needs. Of particular interest are the results concerning the design of the tutorials. One-hundred percent of the students reported that the information was presented in a straightforward and easy to understand manner, and 92.4% agreed that the lengths of the tutorials were appropriate. Finally, 90.8% of the students believed that the material was more easily understood by viewing the tutorials compared to the textbook and guidesheets.
Although the results show that attitudes toward the tutorials were favorable, two items related to the delivery format indicated some concern. Approximately 30% of the students reported that the Juice software was not easy to use, and approximately 25% reported technical difficulties with the software. Despite these concerns, 93.8% would recommend tutorials for other courses.
When students were asked to rate the overall value of the tutorials, 93.9% rated them as average or better. Thirty-seven students provided additional comments that were consistent with the quantitative findings. Ten students simply expressed their positive experience with the tutorials. For example, one student stated, “I could not have imagined completing the course without the vodcasts/tutorials,” and another student referred to the tutorials as “the best thing ever.”
In addition to the general comments supporting the tutorials, examination of the remaining comments identified two recurring themes: (a) technological concerns and (b) the role of tutorials as supplemental material. The only negative comments were provided by 10 students (25.6%) who referred to technology issues related to the access of the tutorials. Seven of these comments concerned the inability to install the Juice software on computers with Microsoft’s Vista operating system. Additional technology-related comments concerned the need to have a high-speed Internet connection.
The second theme was also identified by 10 (25.6%) students and described the role of the tutorials as supplemental. For example, one student stated, “I used every one of the vodcasts after reading to explain and reinforce what I had just read.” Another student stated that the “vodcasts/tutorials were very helpful and a great supplemental resource when it came to reading and understanding each lesson and chapter”. Many of the comments that identified the supplemental role of the tutorials involved the combined use of the tutorials, text, and other resources. However, two students stated that they were able to watch the video and take notes as if they were in a classroom.
Although there were two major themes in addition to the general comments regarding the use of the tutorials, additional comments were made that are worth noting. Three students provided comments related to the human factor that was enhanced. According to one student, “It was like being in the classroom,” and another commented “It really helped bring [the professor] into my house and helped me to better understand the material and apply it to the class and my counseling.” Finally, two students referred to differences in learning styles. One student stated that “everyone learns differently and the use of the vodcasts can be beneficial for someone.” However, the student also noted that “they were not beneficial for me. I learned the material very well from the book and the examples provided.” On the other hand, a second student stated that
“I tried to read the book and follow the text when I first started the class” but “I started to use [the tutorials] . . . I am an auditory learner [and] the vodcast was just what I needed. I never referred to the book for much of anything . . . I got much more information from the vodcast.”
Table 2. Responses to tutorial evaluation items (n = 65)
Item |
Strongly Agree |
Agree |
Uncertain |
Disagree |
Strongly Disagree |
Mean |
The tutorials were interesting |
35.4% |
47.7% |
3.1% |
13.8% |
-- |
4.05 |
The tutorials were enjoyable |
23.8% |
47.6% |
7.9% |
20.6% |
-- |
3.75 |
The length of the tutorials was appropriate for the information |
46.2% |
46.2% |
6.2% |
1.5% |
-- |
4.37 |
The information was provided in a straightforward and easy to understand manner |
63.1% |
36.9% |
-- |
-- |
-- |
4.63 |
Compared to the textbook and guidesheets, I was able to better understand the material by viewing the tutorials
|
55.4% |
35.4% |
4.6% |
3.1% |
1.5% |
4.40 |
I had technical difficulties when trying to view the tutorials
|
6.2% |
16.9% |
1.5% |
32.3% |
43.1% |
3.89 |
The Juice software was easy to use |
27.9% |
35.9% |
7.8% |
9.4% |
17.2% |
3.52 |
The tutorials met my needs |
53.8% |
30.8% |
10.8% |
4.6% |
-- |
4.34 |
I would recommend the use of tutorials in other classes |
61.5% |
32.3% |
1.5% |
4.6% |
-- |
4.51 |
|
Excellent |
Above Average |
Average |
Below Average |
Poor |
|
Rate the overall value of the tutorials that you viewed |
51.5% |
30.3% |
12.1% |
4.5% |
1.5% |
4.26 |
Effect on Academic Achievement
The effect of tutorials on academic performance was examined through comparisons of grades on performance-based tasks. These tasks required the use of SPSS to analyze data related to a scenario that was provided and were chosen because the use of SPSS was the main focus of the tutorials. The first set of tasks involved eight assignments; each assignment provided a scenario, set of data to be entered, and questions to be answered. For each assignment, the directions stated which analysis must be used. The second set of tasks involved four projects that followed the same format as the assignments; however, the student had to determine the appropriate analysis.
The first analyses that examined the effect of tutorials on achievement compared the performance of students enrolled in online sections of the course that had access to the tutorials and sections that did not. All sections used the same delivery format and requirements; therefore, all sections had the same type and number of assignments. The comparison sections were chosen because the instructors had policies (e.g., penalties for late work, etc.) and practices (e.g., timely response to email, etc.) that were similar. Only sections taught during the Spring 2008 term were used.
The results of the independent samples t-test comparing the performance of students in the tutorial and non-tutorial sections are contained in Table 3. The results show that the difference in performance was not statistically significant for either measure, t(112) = 1.53, p = .128 and t(112) = .637, p = .525.
Table 3. Comparison of Tutorial and Non-Tutorial Sections on Performance-Based Assignments
Section |
n |
M |
SD |
t |
df |
p |
|
|
|
Assignments |
|
|
|
|
|
|
|
Tutorial |
35 |
106.97 |
16.75 |
1.53 |
112 |
.128 |
Non-Tutorial |
79 |
102.01 |
15.57 |
|
|
|
|
|
|
|
|
|
|
|
Projects |
|
|
|
|
|
|
|
Tutorial |
35 |
72.36 |
9.82 |
.637 |
112 |
.525 |
Non-Tutorial |
79 |
71.19 |
8.65 |
|
|
|
The purposeful selection of comparison groups for the previous analyses was designed to minimize instructor differences. However, a second set of analyses that removed the instructor variable was conducted. One-sample t-tests were used to compare the performance of students in sections taught by the researcher prior to the use of video tutorials and after. The test criterion was determined by obtaining the mean performance for the three terms prior to the use of the tutorials. The results of the analyses are presented in Table 4. The results show that the differences were not statistically significant, t(69) = 1.49, p = .141 and t(69) = .83, p = .408.
Table 4. Comparison of Researcher’s Sections Before and After Use of Tutorials
Section |
n |
M |
SD |
t |
df |
p |
|
|
|
Assignments |
|
|
|
|
|
|
|
Tutorial |
70 |
104.16 |
17.96 |
1.49 |
69 |
.141 |
Pre-Tutorial (test value) |
|
100.96 |
|
|
|
|
|
|
|
|
|
|
|
|
Projects |
|
|
|
|
|
|
|
Tutorial |
70 |
71.02 |
9.63 |
.83 |
69 |
.408 |
Pre-Tutorial (test value) |
|
70.06 |
|
|
|
|
Summary and Discussion
This study examined the impact of video tutorials in an online, graduate level statistics course. The results were similar to those of Veronokis and Maushak (2005) and found no statistically significant differences in academic performance. However, the students in the present study did have a positive attitude toward the tutorials and would recommend them for other classes. Additionally, two comments supported Brumfield’s (2008) statement that the use of screen capture and audio technology can provide a more “human” learning experience.
Although research on the effectiveness of animation and video remains inconsistent (e.g., Boster et al, 2006; Dupagne, Stacks, & Giroux, 2007; Keefe, 2003; Veronokis & Maushak, 2005), the perceived effectiveness of tutorials by students, as evidenced in the current study, supports a need for further research. Previous research on the effectiveness of video presentations has often compared subjects who were exposed to different conditions (e.g., text only, video and audio only, etc.); however, comments from the current research suggest that the instructional contribution of video presentations may lie in their use as supplemental material. In other words, video presentations may not be the “magic pill” that enhances learning for all students, but they can be one component of an effective instructional design that addresses the different learning styles and needs of students. Even Mayer (2001) recognized that multimedia presentations will not have the same benefit for all learners when he proposed the individual difference principle. This was evidenced in the current study through comments made by students who chose not to use the tutorials because they were able to understand the material without them.
As the availability of online courses grows, faculty must continue exploring technologies that will make these courses as effective as traditional face-to-face courses. The results of this study suggest that video presentations may help accomplish this goal.