Twenty Years of Research on the Academic Performance Differences
Between Traditional and Distance Learning: Summative Meta-Analysis
and Trend Examination
|
Abstract
This meta-analysis research estimated and compared the differences between the academic performance of students enrolled in distance education courses, relative to those enrolled in traditional settings, as demonstrated by their final course grades/scores, within the last twenty year (1990-2009) period, further broken down to four distinct sub-periods. A large k=125 of experimental and quasi-experimental studies met the established inclusion criteria for the meta-analysis (including data from over 20,000 participating students), and provided effect sizes, clearly demonstrating that: (1) In 70% of the cases, students taking courses by distance education outperformed their student counterparts in the traditionally instructed courses; (2) The overall effect size ‘d+’ (random method) was calculated as 0.257 (0.17< 95% CI <0.35); and (3) a clear upward trend of overall effect size ‘d+’ exists for the 2000-2009 decade after a decline in the second half of the 1990s. A polynomial regression confirmed a parabolic solution with a clear minimum point. The research, theoretical, and policy implications of these results are discussed.
Keywords: Traditional Learning, Distance Learning, Meta-Analysis, Summative Evaluation, Trend Analysis, Academic Performance.
|
Introduction
The last decade of the 20 th Century and the first of the 21 st have seen dramatic changes due to the exponential proliferation of telecommunications and the Internet to all aspects of life. Said technological changes have also influenced education systems to pursue the development, incorporation, and blending of new and innovative methods of and for delivering education.
The transformation from the traditional Face-to-Face (FTF) classroom mode to new delivery methods and platforms (correspondence, Internet-online, one-way, two-way audio and video) collectively known as Distance Education (DE), led some experts so far as to predict that the ‘residential based model,’ that is, students attending classes at prearranged times and locations, will disappear in the near future (Blustain, Goldstein & Lozier, 1999; Drucker, 1997 as cited in O’Malley, 1999). It is beyond doubt that distance education has progressed in concept and practice (to encompass where applicable) from an “anywhere” to an “anytime” to an “any pace” delivery method.
The advent of these highly technological methods was not easily accepted by the academic and training communities, which continuously examined, assessed, criticized, hallowed and demonized them. The major concern about DE programs was and is its quality relative to FTF classroom education in four domains of coursework delivery: (1) student attitude and satisfaction, (2) interactions of students and faculty, (3) student learning outcomes, and (4) faculty satisfaction (Gallagher & McCormick, 1999). This concern has resulted in extensive research into the factors that affect the quality of these programs. Consequently, a plethora of new scholarly articles on the subject emerged, examining various aspects of teaching and learning in a comparative FTF vs. DE setting in diverse topics / subjects and across academic (primary, secondary, tertiary) and professional (medical clinical and management training and development) levels. (Dessler, 1997; Mondy, Noe & Premeaux, 1999; Westwood, 2001).
As there are ‘broad’ measures pertaining and affecting the instructional efficacy and student learning in both situations and as the many individual study findings varied in scope, magnitude and contradictory directions, a confusing and inconclusive response to the overall question of effectiveness was commonly reported. ( Dellana, Collins & West, 2000; DeSantis, 2002; Phipps & Merisotis, 1999).
To overcome this, a second “wave” of research emerged focusing on the synthesis of multiple studies and the examination of the differences between the two methods of delivery, utilizing meta-analytical (MA) methods and procedures.
But MA studies also differ amongst themselves in their study design, scope, and most importantly in the definition of their dependent variable. Although the Meta-Analysis Concept and Procedures are detailed in-depth in the methods section, a brief explanation is presented here: A meta-analysis on a given research topic is directed toward the quantitative integration of findings from various studies. Each study serves as the unit of analysis; the findings between studies are compared by transforming the results to a common standardized metric called an effect size (ES). Once all effect sizes of the individual studies are acquired, the overall (for all studies) pooled mean effect size estimate ‘d+’ is calculated.
Of those with a final learning outcome/academic achievement as their DV of choice and sound statistical procedures, the most notably and assiduously executed are: (a) Shachar (2002) and Shachar & Neumann (2003) with k=86 and a ‘d+’=.366, Bernard et al. (2004) with k=318 and a ‘d+’=.013, and a most recent U.S. Department of Education Report (2009) with an overall k=51 and a ‘d+’=.24 (of which k=28 ‘pure’ Online vs. Traditional studies yielded a ‘d+’= .14, and k=23 ‘blended’ online/FTF vs. Traditional studies yielded a ‘d+’= .35).
The purpose and aims of this study extend beyond the scope of all previous MA studies and are threefold: (a) to provide a summative answer to the question of the differences on academic performance between traditional and distance learning programs in the last twenty years, (b) to identify distinct educational periods in the last two decades, and (c) to examine the trend across the distinct educational periods on the academic performance dependant variable. Hence, the following research questions (RQ) were defined:
RQ1: Is there a difference in the Final Academic Performance of students enrolled in distance-learning programs relative to those enrolled in traditional FTF programs for the last twenty year period and its distinct sub-periods?
RQ2: Is there a statistically significant difference in the Final Academic Performance of students between and across the last twenty years’ sub-periods?
RQ3: Are the changes observed and calculated across time consistent, and can directional patterns be identified?
Note : RQ1and RQ2 were hypothesized and statistically tested by Meta-Analysis and ANOVA respectively. RQ3 is examined for pattern and trend by the polynomial regression.
Methodology
The Meta-Analysis Concept and Procedures
Concept. In order to synthesize the various studies, a statistical technique called ‘Meta-Analysis’ (MA) developed by Glass, McGraw and Smith (1981) has been implemented in this study. A meta-analysis on a given research topic is directed toward the quantitative integration of findings from various studies. Each study serves as the unit of analysis; the findings between studies are compared by transforming the results to a common standardized metric called an effect size (ES) (Becker, 1998; Cook, Heath & Thompson, 2000; Lemura, Von Duvillard & Mookerjee, 2000). In the simplest form, the ES as denoted by the symbol ‘d,’ is the mean difference between groups in standard score form, i.e., the ratio of the difference between the means to the standard deviation. (Yu, 2001). Furthermore, “Glass argued that literature review should be as systematic as primary research and should interpret the results of individual studies in the context of distributions of findings, partially determined by study characteristics and partially random.” (Bangert-Drowns & Rudner, 1991). Caveat - As in many other fields, the concept in itself, does not promise accurate or true results. It is the strict adherence to the procedures, and systematic treatment and analysis of the data, which will ensure acceptable statistical findings.
Meta-Analytic Approach Implemented. Within the field of MA, there are different approaches to the procedures, computations, and interpretation of results. Hence, the need to briefly describe the meta-analytic research type, approach and parameters chosen and implemented for this study: (1) Inclusion rules were more selective. Studies with serious methodological flaws were excluded. (2) The study is the unit of analysis, i.e., one effect size was computed for each study pertaining to a well defined dependent variable – final course grade. (3) Effect sizes are of separate and independent studies. (4) Hunter and Schmidt's (1990) corrections for sampling error, measurement error, range restriction, and other systematic artifacts were applied to the distribution of effect sizes. (5) Effect sizes were examined ‘within’ each stratum and ‘across’ all of the studies/strata.
Meta-Analytic Procedures Followed and Executed in the Study. The meta-analysis procedures described below follow the Campbell Collaboration Statistical Analysis (2004) standards, and the Meta-Analysis Reporting Standards (MARS), as required by the American Psychological Association (APA) (2008).
- Domain of Research. The Independent variable is the method/mode of delivery, operationalized as: (1) Distance education mode, and (2) The traditional Face-To-Face (FTF) mode. The dependent variable Final Academic Performance (final grade of course studies). Note - Grades are the measure of choice in numerous studies in higher education to assess learning and the course impact on the cognitive development of the student in the subject-matter (Anaya, 1999).
- Criteria for Including Studies in the Review: Criterion 1 - The time period covered in the review: from 1990 to 2009. Criterion 2 - The quality of a study – Only studies showing no severe methodological flaws were included. Criterion 3 - Control group - Each primary study had a control or comparison group. Criterion 4 - Sufficient Quantitative Data - The results in these studies all provided sufficient quantitative data for the two groups: sample size, mean, standard deviation, and/or “ t”, “ F”, or “ r” correlation statistics, from which effect sizes were calculated.
- Searching for Relevant Studies. The search for study materials was carried out using several different approaches: Computer Search - All searches were for published, un-published, dissertations, conference papers, and study reports, principally in the English, German, French, Spanish and Italian languages, utilizing electronic search engines Pro-Quest, Google Scholar, ERIC, and MedLine. The electronic library and inter-library data banks and services of TUI University, and Tel Aviv University were scanned as well. Compilations, Reference Lists, and Authors – have been the source for many valuable references. When studies presented incomplete statistical data, direct email requests were sent out to the study authors for additional data.
- Data Extraction, Coding, and Selection of Final Set of Studies. All studies were compiled into a master database (MDB), within a MS-Excel spreadsheet file (after being assigned a unique ‘I.D. Number’). Studies were reviewed for relevant information and note-worthy characteristics that might be related to the effect size pertinent to this study . Data on variables of interest were extracted, recorded and appended to the MDB and coded for the following main characteristics: factors in research design, list of sample characteristics, and exact type of dependent variable. Yield – Over 1,850 comparative papers were reviewed, but subject to strict initial inclusion criteria screening, only 125 studies qualified for this study.
- Individual Effect Size. Different statistical methods exist for combining the data, but there is no single ‘correct’ method (Egger, Smith & Phillips, 1997). In this study, based on the statistical methods described in Buchan (2000), the estimation of the individual study effect size was calculated by following Hedges and Olkin (1985, P.78-81) for estimating the ‘g’ effect size: Modified Glass statistic with pooled sample standard deviation:
 , and correcting its sample bias to obtain the unbiased estimator ‘d’ effect size ( Caveat - not to be confused with Cohen’s ‘d’) by: , and correcting its sample bias to obtain the unbiased estimator ‘d’ effect size ( Caveat - not to be confused with Cohen’s ‘d’) by:  . Note: For both ‘g; and ‘d’, 95% confidence intervals (CI) were calculated, utilizing a statistical computing software program (Stats Direct LTD (2009)). Note: By convention the subtraction of the means (M) of the 2 groups (experimental and control), is done so that the difference is ‘positive’ if it is in the direction of improvement or in the predicted direction and ‘negative’ if in the direction of deterioration or opposite to the predicted direction. . Note: For both ‘g; and ‘d’, 95% confidence intervals (CI) were calculated, utilizing a statistical computing software program (Stats Direct LTD (2009)). Note: By convention the subtraction of the means (M) of the 2 groups (experimental and control), is done so that the difference is ‘positive’ if it is in the direction of improvement or in the predicted direction and ‘negative’ if in the direction of deterioration or opposite to the predicted direction.
- Overall Effect Size ‘d+’. Once all effect sizes of the individual studies were acquired, the overall (for all studies) pooled mean effect size estimate ‘d+’ was calculated using direct weights defined as the inverse of the variance of ‘d’ for each study/stratum. A 95% approximate confidence interval for ‘d+’ is given with a chi-square statistic with the probability of this pooled effect size being equal to zero (Hedges & Olkin, 1985). Consequently and conservatively - the null hypothesis is rejected if the probability for ‘d+’ being equal to zero is smaller than 0.01.
- Heterogeneity and Inconsistency. Two separate statistical models: fixed methods and random methods (differing in the way the variability of the results between the studies is treated), were run on the ‘d+’ statistic. The classical measure of heterogeneity is Cochran’s ‘Q’, which is distributed as a chi-square statistic with df = k-1. The ‘Q’ statistic has low power as a comprehensive test of heterogeneity especially when the number of studies is small. Hence, the ‘I 2’ inconsistency statistic was calculated (‘I 2’ = 100% x (Q-df / Q), yielding and describing the percentage of the variation across studies that is due to heterogeneity rather than chance. When ‘I 2’ was found to be high, the random method model was chosen of the two (DerSimmonian & Laird, 1986).
- Homogeneity, Bias, and Fail Safe N Analyses. As a synthesis of a variety of studies and data was conducted, each with its own method of calculation, it was necessary (for the results to be accepted), to examine the robustness of the findings to different assumptions, by conducting a ‘ Homogeneity and Bias’ analysis:
a. Homogeneity. The individual trials will show chance variation in their results, therefore, it was necessary to explore whether the differences were larger than those expected by chance alone. One of the main concerns in conducting meta-analysis is that there would be a publication bias arising when trials with statistically significant results are more likely to be published and cited, and are preferentially published in English language journals (Jüni, Holenstein, Sterne, Bartlett & Egger, 2001). The outcome of which would be that plots of trials' variability or sample size against effect size would be usually skewed and asymmetrical in the presence of publication bias and other biases (Sterne & Egger, 2001), and are more likely to affect small trials. Hence, all MA iterations were completed by bias plotting the sample sizes against effect estimate, and visually (see Figure 2) examined for left-right asymmetry caused by bias (Buchan, 2000; StatsDirect, 2009).
b. Fail Safe N. Since mostly published studies are the ones analyzed, there is the ‘ file drawer problem,’ that is, how many studies with non-significant findings, were not published? Therefore, the Fail Safe N (NFS) is the number of non-significant studies that would be necessary to reduce the effect size to a non-significant value. Based on Orwin’s (1983) formula, an NFS was calculated for each meta-analysis iteration on a ‘d+’ critical level of 0.01.
- Qualitative Interpretation of Effect Size (d+). Interpreting the results of a meta-analysis requires the understanding of the standards employed that allow for meaningful interpretation of effect sizes. The statistical community is not of one voice in regard to the interpretation of the effect sizes and although judgments about whether a specific effect size is large or small are ultimately arbitrary, some guidelines for standards do exist in the literature, to assess the meaningfulness of an effect size - on one hand, and for conventional measures- on the other, e.g. Cohen (1977) suggested 0.2, 0.5, and 0.8 as minimal, moderate, and meaningful effect respectively; Lipsey (1990) categorized effect sizes into three groups: Small<0.32; 0.33<Medium<0.55; and Large>0.56.
Research Results
Following the review and examination of all study publications in the data bank, k=125 studies (encompassing about 20,800 students: traditional n=11,500 vs. distance learning n=9,300), met all required criteria and were, therefore, the works under consideration for this study. Data extraction and analysis from these works produced 125 calculated ‘g’ effect sizes. These 125 effect sizes are the ‘base’ of the meta-analysis iterations conducted to answer the study’s research questions.
The 19 year span of 1990-2009 was broken down into 4 distinct sub-periods: Period I: 1991-1998, Period II: 1999-2000, Period III: 2001-2002; and Period IV: 2003-2009, with studies/effect sizes totaling: 38, 33, 29, and 25 respectively. Said breakdown of periods (although uneven in length) and their corresponding number of studies, allowed the conduct of four meta-analysis iterations (for at least k=>25), and period comparisons for and on all four sub-periods.
The student body per study was divided across three different levels of education with a clear majority of the college and under-graduate level: university graduate: n=24 (19%), university under-graduates and colleges: n=79 (63%), and other non-degree courses: n=22 (18%).
Overall, 70% of the studies had a positive effect size (see Figure 1), demonstrating that DL students outperformed their traditional counterparts. Note – there is a clear upward trend of higher positive ES per period across time from 63% to 84% (see Table 1).
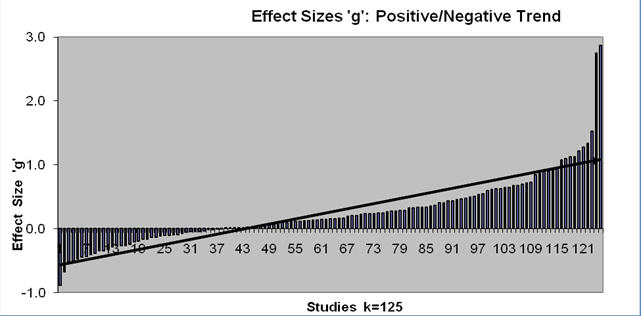
Figure 1 : Positive/Negative ‘g’ effect sizes, k=125
Table 1: Descriptive Findings
Period |
k |
ES Pos.
n (%) |
FTF Students
n (%) |
DE Students
n (%) |
Graduate
k (%) |
Under Grad.
+ College
k (%) |
Other
k (%) |
I 1991-1998 |
38 |
24 (63%) |
4,392 (50%) |
4,454 (50%) |
7 (18%) |
21 (55%) |
10 (26%) |
II 1999-2000 |
33 |
22 (67%) |
1,924 (58%) |
1,393 (42%) |
10 (30%) |
20 (61%) |
3 (9%) |
III 2001-2002 |
29 |
20 (69%) |
3,802 (64%) |
2,102 (36%) |
0 (0%) |
27 (93%) |
2 (7%) |
IV 2003-2009 |
25 |
21 (84%) |
1,380 (51%) |
1,337 (49%) |
7 (28%) |
11 (44%) |
7 (28%) |
All 1991-2009 |
125 |
87 (70%) |
11,498 (55%) |
9,286 (45%) |
24 (19%) |
79 (63%) |
22 (18%) |
RQ1. Is there a difference in the Final Academic Performance of students enrolled in distance-learning programs relative to those enrolled in traditional FTF programs for the 1990-2009 period and its sub-periods?
Sample. 125 ‘g’ effect sizes were calculated for final academic performance and corrected to obtain the un-biased ‘d’ (not to be confused with Cohen’s ‘d’) effect sizes.
Pooled Estimate of Effect Size ‘d+’ . Five consecutive meta-analysis iterations were run on the data for: All periods (1991-2009) and the four sub-periods, computing for both the fixed and random methods, the ‘ I 2’ inconsistency and the Chi square statistics (see Table 2).
As expected (due to the diverse sources and methods of the individual studies), the ‘I 2’ was found to be high, and so the results calculated per the random method are the appropriate ones chosen to be considered.
All Periods. Computation of the pooled estimate of effect size ‘d+’ (random) for all periods yielded the final statistically significant result of 0.257 (p<.01), with a 95% confidence interval of 0.17 to 0.35. The Chi Square that ‘d+’ differs from zero (df=1) of 32.13 (P<0.0001) is statistically significant.
Sub-Periods. Computation of the pooled estimate of effect size ‘d+’ (random) for the four sub-periods, yielded statistically significant results for periods I, III, and IV, whereas the ‘d+’ of period II was small and statistically non-significant.
Note – The course and trend of the ‘d+’ statistics across time will be presented in the following RQ3 section.
Table 2: Meta-Analysis Findings
Period |
k |
‘d+’ Fix (CI) |
‘d+’ Rand (CI) |
‘I 2’ |
NFS d c=.01 |
I 1991-1998 |
38 |
.548** (.50, .60) |
.268** (.09, .45) |
90 % |
3,225 |
II 1999-2000 |
33 |
.077* (.00, .15) |
.068 (-.05, .19) |
57 % |
725 |
III 2001-2002 |
29 |
.225** (.17, .28) |
.310** (.16, .46) |
81 % |
3,750 |
IV 2003-2009 |
25 |
.353** (.27, .43) |
.403** (.20, .60) |
83 % |
4,913 |
All 1991-2009 |
125 |
.342** (.31, .37) |
.257** (.17, .35) |
86 % |
3,088 |
p < .05; **p < .01;
Bias Indicators Numbers and Plot
All Periods. Kendall's test on standardized effect vs. variance: t = 0.0617; p = 0.3094. An examination of the left-right symmetry of the plot as depicted in Figure 2 denotes that there is a small sample bias.
Sub-Periods. A visual examination of the left-right symmetry of the bias plots of the four sub-periods as depicted in Figure 3 denotes that there is a decreasing sample bias as we progress across time periods.
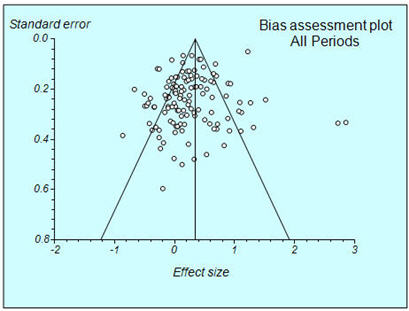
Figure 2: Bias Assessment Plot – All Periods
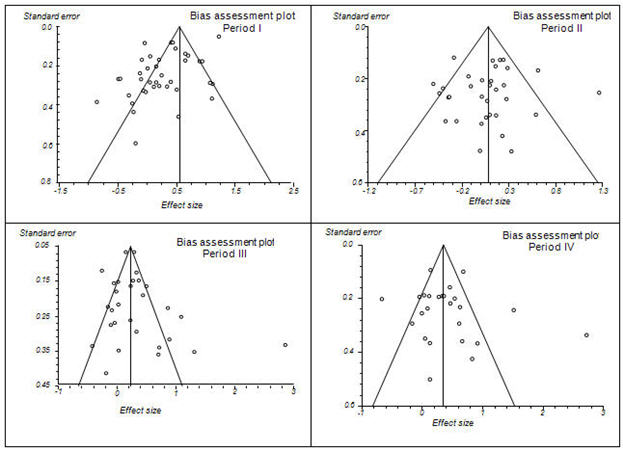
Figure 3: Bias Assessment Plot – Sub-periods
Fail Safe N. Based on Orwin’s (1983) formula for calculating the N fail safe number when the ‘critical’ criterion value of d c = 0.01 is selected, about 3,088 additional unreported studies averaging a ‘null’ result are needed (existing somewhere), to ‘nullify’ the average of ‘d+’(random) = 0.257. The fail safe N for the overall study period and the sub-periods are in their hundreds and thousands. It is unlikely that there are that many well constructed studies sitting in file drawers to negate our results (See Table 3).
Hypothesis Decision. Based on these findings, providing an overall effect size ‘d+’ (random) of .257 p<.01, from 125 studies, with a statistically significant Chi Square (df=1) of 32.13, (p<.0001), the null hypothesis that there would be no difference between the Final Academic Performancegrades of students enrolled in distance-learning programs than those enrolled in traditional FTF programs is rejected. The direction of the difference between the two mediums of delivery demonstrates that the DE students outperformed their FTF counterparts across the full continuum of the study period.
Table 3: Major Findings
Period |
k |
ES Pos. n (%) |
‘d+’ Rand. (CI) |
NFS d c=.01 |
I 1991-1998 |
38 |
24 (63%) |
.268** (.09, .45) |
980 |
II 1999-2000 |
33 |
22 (67%) |
.068 (-.05, .19) |
191 |
III 2001-2002 |
29 |
20 (69%) |
.310** (.16, .46) |
870 |
IV 2003-2009 |
25 |
21 (84%) |
.403** (.20, .60) |
983 |
All 1991-2009 |
125 |
87 (70%) |
.257** (.17, .35) |
3,088 |
*p < .01
RQ2. Is there a statistically significant difference in the Final Academic Performance of students between the 1990-2009 sub-periods?
An ANOVA test was run to assess whether the four sub-period ‘d+’ means (period I 1991-1998 (k=38), period II 1999-2000 (k=33), period III 2001-2002 (k=29), and period IV 2003-2009 (k=25)) differ among themselves. The between-groups’ combined test results are F (3,124) = 2.657 at the s = 0.05 level, indicating that four distinct periods within the 1990-2009 time frame have been established. LSD post-hoc analyses revealed a significant difference between the means of periods II – III (p=.035), and II – IV (p=.010).
RQ3. Are the changes observed and calculated across time consistent, and can directional patterns be identified?
As presented above, the four sub-periods are distinctly different and provide three positive separate patterns: (a) The proportion/ratio of positive effect sizes across time, growing steadily from 63% in period I to 67% in period II, 69% in period III, and then in a larger increment to 84% in period IV, (b) The average ‘g’ statistics calculated for each period were: .243, .064, .354, and .433 respectively (see Figure4), and (c) the pooled ‘ d+’ (random) was calculated as d+=.268 for the first period, to decline to a low of d+=.068 in the second, and then incline to a d+=.310 in the third, and continue to grow upwards to a level of d+=.403 in the fourth period.
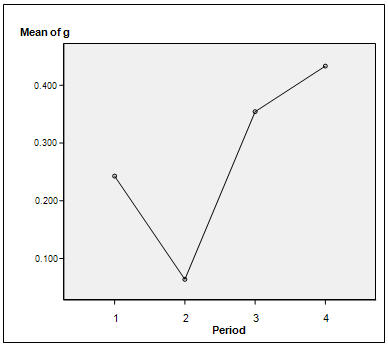
Figure 4: ‘g’ ES trend across periods/time (Legend: Period I: 1991-1998;
Period II: 1999-2000; Period III: 2001-2002; Period IV 2003-2009.)
As observed in Figure 4, the ‘g’ ES trend depicts a U curve across time. A quadratic (2 nd order) polynomial regression with the ‘d+’ as the dependent variable and the four periods as the independent variable (see Figures 4a and 4b), to obtain the following high (although statistically non-significant) R 2 results of .829 and .708 for the ‘d+’ (fixed) and ‘d+’ (random) regressions respectively. The quadratic regression equations were:
- ‘d+’ (fix) = 1.159 - .792 Period + .15 Period 2 (with a ‘minimum’ of 2.6)
- ‘d+’ (random) = .467 - .302 Period + .073 Period 2 (with a ‘minimum’ of 2.1)
The upward inflection point in both regressions occurred at the beginning of the 1999-2000 period.
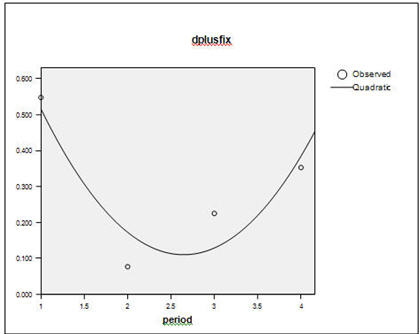
Figure 4a : ‘d+’ (fixed) ES trend across periods/time
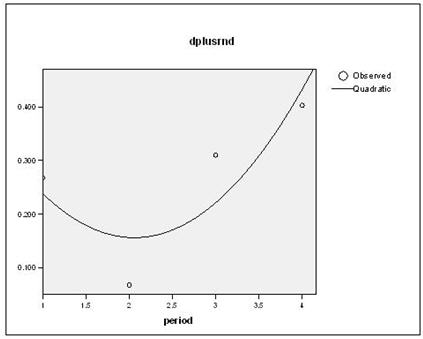
Figure 4b : ‘d+’ (random) ES trend across periods/time
Discussion
Aggregating and consolidating all previous findings for the research questions within one table (see Table 3) facilitates the following review and discussion.
Overall, the results of the meta-analyses, based on 125 qualifying studies and using learning outcome data from over 20,800 participating students, demonstrates a sound and statistically significant positive ‘d+’ statistic of .257, p<.01 calculated conservatively by random methods for the study period, indicating that distance education not only is comparable to traditional instruction, but also, subject to our criteria, can outperform traditional instruction.
The proportion of studies with positive effect sizes to the total number of studies per period, demonstrated a continuous growth from 63% in period I to 84% in period IV.
When the sub-periods were analyzed and their respective ‘d+’ effect sizes were calculated they were all positive, and due to the robustness (large k number) of the study, the power to detect said effect sizes is further confirmed by the large Fail Safe Numbers (NFS), as it is quite unlikely that there are that many well constructed studies “sitting” in file drawers.
Therefore, this study’s findings completed and complemented with the previous meta-analyses of Shachar (2002), Shachar & Neumann (2003), Bernard et al. (2004) and the U.S. Department of Education report (2009), seem to finalize the ongoing debate over the quality of DE education and consequently DE should be accepted as a respectable and feasible option for education.
Even though this study did not differentiate between the educational delivery methods of time (synchronous and asynchronous) and place (same and different) dimensions, as categorized by O’Malley and McCraw (1999), or the various technological and telecommunication delivery systems, but rather remained with the general dichotomy of all distant (teacher–student geographically separated) courses, vs. all traditional courses, the trend of the four periods’ ‘d+’, when graphed together, depicting a clear U curve graph with an upward infliction point occurring in the 1999-2000 period (see Figure 4), demand an in-depth and insightful look at the possible educational and pedagogical factors affecting said periods, e.g., in the first period the ‘classic’ text-book was mostly just converted as-is to a CD or web based medium vs. the fourth period where new web software applications enhanced multi-level learning styles.
Eduventures (a reputable Boston based research and consulting group in higher education) forecasts there were nearly 2.2 million U.S. students enrolled in fully online higher education programs in 2009, or about 12.1% of all students enrolled in university level degree-granting institutions that year by these estimates. This share is up significantly from approximately 1.3% in the 2000-2001 academic school year.
While distance learning in higher education may have been looked down upon two decades ago, it has clearly become well accepted and gained legitimacy over the past decade. Students, universities, and employers no longer differentiate between university degrees earned traditionally or online. In many cases, universities offer the same degrees traditionally and online while the final diploma does not even mention the mode of delivery. The improvements of technology, the widespread Internet access, the increased legitimacy of online learning within established universities and employers, and the increased participation of adult learners in higher education with clear preferences toward learning anytime and anywhere will further drive future improvements in the quality of distance learning programs. Traditional programs suffered irreparable damages during periods of economic downturns (the post dot com era in 2000-2002 and the major economic recession from 2007-2009), their levels of support have eroded substantially, and their quality did not improve at the same levels as online programs.
Therefore, one should not be surprised if the gap in academic performance between online and traditional learning will only widen in the next decade.
The findings of this study reemphasize prior results and extend it for a period of twenty years. It is clear that the experimental probability of attaining higher learning outcomes is greater in the online environment than in the face-to-face environment. This probability is increasing over time. The future should call for different treatment of online learning by policy makers and regulatory agencies – on one hand, and future research to examine DE learning by: academic subject, asynchronous / synchronous / blended methods etc. – on the other.
The paradigm of the superiority of the FTF modality over its distance learning alternative has been successfully negated. The distance learning approach is becoming the “normal science” (Kuhn, 1962). Yet, this is not fully comprehended by the various decision making institutions where the gate-keeping positions represent, by and large, the past paradigm. Therefore, distance learning is still treated as the anomaly (“step child”) instead of as the emerging standard of quality in higher education. We expect that as a new generation of leaders in higher education emerges, the policy making orientation and regulatory models will change to reflect the new paradigm.
|
References
Anaya, G. (1999). College impact on student learning: Comparing the use of self-reported gains, standardized test scores, and college grades. Research in Higher Education, 40 (5), 499-526.
APA - American Psychological Association (2008). APA Publications and Communications Board Working Group on Journal Article Reporting Standards. American Psychologist, 63, pp.848-849.
Bangert-Drowns, R. L., & Rudner, L. M. (1991). Meta-Analysis in Educational Research. ERIC Digest. ERIC Clearinghouse on Tests Measurement and Evaluation Washington, DC.
Becker, L. A. (1998). Meta-analysis. Retrieved 23 May 2010, from http://web.uccs.edu/lbecker/Psy590/es.htm
Bernard, R. M., Abrami, P. C., Lou, Y., Borokhovski, E., Wade, A., Wozney, L., Wallet, P.A., Fiset, M., & Huang, B. (2004). How does distance education compare with classroom instruction? A meta-analysis of the empirical literature. Review of Educational Research. Fall 2004, Vol. 74, No. 3, pp. 379-439
Blustain, H., Goldstein, P., & Lozier, G. (1999). "Assessing the New Competitive Landscape," in Dancing with the Devil, Editors: Richard N. Katz and Associates, Jossey-Bass Publishers, San Francisco.
Buchan, I. E. (2000). The Development of a Statistical Computer Software Resource for Medical Research. Doctorate Thesis - University of Liverpool. Liverpool, England
Campbell Collaboration Methods Policy Brief (2004). Retrieved 23 May 2010 from: http://www.campbellcollaboration.org/resources/methods_policy_briefs.php
Cohen, J. (1977). Statistical Power Analysis for the Behavi oral Sciences (rev. ed.) (New York: Academic Press).
Cook, C., Heath, F., & Thompson, R. (2000). A meta-analysis of response rates in Web- or Internet-based surveys; Educational and Psychological Measurement [H.W. Wilson - EDUC]; Dec 2000; Vol. 60, Iss. 6; pg. 821.
Dellana, S., Collins, W., & West, D. (2000). On-line education in a management science course--effectiveness and performance factors. Journal of Education for Business; Washington.
DerSimonian, R., & Laird, N. (1986). Meta-analysis in Clinical Trials. Controlled Clinical Trials 1986; 7:177-188.
DeSantis, C. (2002). eLearners.com web site. Retrieved November 2, 2002, from http://elearners.com/
Dessler, G. (1997). Human Resource Management, 7 th Ed. Prentice Hall.
Egger, M., Smith, D., & Phillips, A. (1997). Meta-analysis Principles and procedures. BMJ No 7121 Volume 315 Education and debate.
Gallagher, P., & McCormick, K. (1999). Student satisfaction with two-way interactive distance education for delivery of early childhood special education coursework. Journal of Special Education Technology; Nashville;
Glass, G. V., McGraw, B., & Smith, M. L. (1981). Meta-analysis in social research. Beverly Hills: Sage Publications.
Hedges, L. V., & Olkin, I. (1985). Statistical methods for meta-analysis. London: Academic Press 1985.
Hunter, J. E., & Schmidt, F. L. (1990). Methods of meta-analysis: Correcting error and bias in research findings. Newbury Park, CA: Sage Publications.
Juni, P., Holenstein, F., Sterne, J., Bartlett, C., & Egger, M. (2001). Direction and impact of language bias in meta-analyses of controlled trials: empirical study. International Journal of Epidemiology 2001; 31:115-123 .
Kuhn, T. (1962). The Structure of Scientific Revolutions. Publisher - University of Chicago Press, 1962
Lemura, L., Von-Duvillard, S., & Mookerjee, S. (2000). The effects of physical training of functional capacity in adults: Ages 46 to 90: A meta-analysis; Journal of Sports Medicine and Physical Fitness Turin; Mar 2000; Vol. 40 Iss. 1; pg. 1
Lipsey , M. W. ( 1990). Design Sensitivity: Statistical Power for Experimental Research. Newbury Park, CA: Sage Publications.
Mondy, Noe, & Premeaux. (1999). Human Resource Management, 7 th Ed. Prentice Hall.
O'Malley, J., & McCraw, H. (1999), Students Perceptions of Distance education, Online Learning and the Traditional Classroom. Online Journal of Distance education Administration, Volume II, Number IV, Winter1999
Orwin, R. G. (1983). A fail safe N for effect size in meta-analysis. Journal for Educational Statistics, 8, 157-159.
Phipps, R., & Merisotis, J. (1999). What’s the Difference? A review of Contemp orary Research on the Effectiveness of Distance education in Higher Education. The institute for Higher Education policy.
Shachar, M. (2002). Differences Between Traditional and Distance Learning Outcomes: A Meta-Analytic Approach. UMI Dissertation Services, ProQuest, ISBN 0-493-87403-8
Shachar, M., & Neumann, Y. (2003). Differences Between Traditional And Distance Education Academic Performances: A Meta-Analytic Approach. The International Review of Research in Open and Distance Learning(IRRODL), Volume 4, No 2.
StatsDirect Statistical Tools (2009). StatsDirect Ltd. Retrieved 20 October 2009, from: www.statsdirect.com
S terne, J., & Egger, M. (2001). Funnel plots for detecting bias in meta-analysis: Guidelines on choice of axis. Journal of Clinical Epidemiology 2001; 54:1046-1055.
U.S. Department of Education, Office of Planning, Evaluation, and Policy Development (2009). Evaluation of Evidence-Based Practices in Online Learning: A Meta-Analysis and Review of Online Learning Studies, Washington, D.C., 2009.
Westwood, R. (2001). “Developing an E-Learning Strategy for Your Organization”. PeopleTalk magazine, BC Human Resources Management Association.
Yu, C. (2001). Meta-analysis and effect size. (available upon request). Retrieved July 2003, from http://seamonkey.ed.asu.edu/~alex/teaching/WBI/es.html
|

Appendix: Meta-Analysis: Qualifying Studies
Aberson, C. L., Berger, D. E., Healy, M. R., & Romero, V.L. (2003). Evaluation of an interactive tutorial for teaching hypothesis testing concepts. Teaching of Psychology 30 (1):75–78.
Al-Jarf, R. S. (2004). The effects of Web-based learning on struggling EFL college writers. Foreign Language Annals 37 (1):49–57.
Bacon, S. F., & Jakovich, J.A. (2001). Instructional Television Versus Traditional Teaching of an Introductory Psychology Course. Teaching of Psychology. Volume: 28 Number: 2 Page: p88 - p92
Barker, T. B. (1997). Developing Courseware for Distance Learning Any Place, Any Time. College of Engineering, Rochester Institute of Technology Rochester, New York
Benjamin, S. E., Tate, D. F., Bangdiwala, S. I., Neelon, B. H., Ammerman, A. S., Dodds, J. M., & Ward, D. S. (2008). Preparing child care health consultants to address childhood overweight: A randomized controlled trial comparing Web to in-person training. Maternal and Child Health Journal 12(5):662-669.
Brown, B., & Liedholm, C. (2002). Can Web Courses Replace the Classroom in Principles of Microeconomics? American Economic Review. Volume: 92, Issue: 2. Page(s): 444-448.
Brugna, R. A. (2008). Augmenting the Clinical Clerkship Curriculum of a Physician Assistant Training Program with Distance Education Technology: Educational Outcomes and Student Perceptions. Dissertation. UMI # 3311299.
Bruning, R., Landis, E., Hoffman, E., & Grosskopf. (1993). Perspectives on an Interactive Satellite-based Japanese language Course. The American Journal of Distance Education - 7(3): 22-38
Cahill, D., & Catanzaro, D. (1997). Teaching first-year Spanish on-line. Calico Journal 14 (2–4):97–114.
Cambell, M., Floyd, J., & Sheridan, J. (2001). Assessment of student performance and attitudes for courses taught online versus onsite. The Journal of Applied Business Research, 18(2).
Carey, J. M. (2001). Effective Student Outcomes: A Comparison of Online and Face-to-Face Delivery Modes. DEOSNEWS Vol.11 No. 9, ISSN 1062-9416.
Casanova, R.S. (2001). Student Performance in an Online General College Chemistry Course. Cape Fear Community College Wilmington, NC 28401
Cheng, H., Lehman, J., & Armstrong, P. (1991). Comparison of Performance and Attitude in Traditional and Computer Conferencing Classes. The American Journal of Distance Education - Vol. 5, No. 3. pp. 51-64.
Clack, D., Talbert, L., Jones, P., & Dixon, S. (2002). Collegiate Skills Versatile Schedule Courses. School Craft College
Coates, D., Humphreys, B. R., Kane, J., Vachris, M., Agarwal, R., & Day, E. (2001). "No Significant Distance" Between Face to Face and Online Instruction: Evidence from Principles of Economics. Paper presented at the meetings of the Allied Social Science Association, January 5-7, 2001, New Orleans, Louisiana
Coe, J. R., & Elliot, D. (1999). An evaluation of teaching direct practice courses in a distance education program for rural settings. Journal of Social Work Education, 35, 353-365
Collins, M. (2000). Comparing web, correspondence and lecture versions of a second-year non-major biology course. British Journal of Educational Technology 31(1): 21-27.
Dalton, B. (1999). Evaluating Distance Education. University of South Carolina. Online: http://www.sc.edu/cosw/PDFs/daltonb.PDF.
Davies, R., & Mendenhall, R. (1998). Evaluation comparison of online and classroom instruction for HEPE 129-Fitness and Lifestyle Management course. Provo, UT: Brigham Young University (ERIC Document Reproduction Service No. ED 427 752)
Day, T. M. (1996). The effects of World Wide Web instruction and traditional instruction and learning styles on achievement and changes in student attitudes in a technical writing in agricommunication course. UMI Dissertations #1382467.
DeBord, K. A., Aruguete, M. S., & Muhlig, J. (2004). Are computer-assisted teaching methods effective? Teaching of Psychology 31 (1):65–68.
Dejnaronk, A. (1999). A Preliminary Investigation of Online Education, Online Students, and their Learning Outcomes. University of Illinois at Springfield.
Deka, T. S., & McMurry, P. (2006). Student Success in Face-To-Face and Distance Teleclass Environments: A matter of contact? I nternational Review of Research in Open and D istance Learning . Volume 7, Number 1. ISSN: 1492-3831
Dellana, S., Collins, W., & West, D. (2000). On-line education in a management science course--effectiveness and performance factors. Journal of Education for Business; Washington.
Diaz, D. P. (2000). Comparison of student characteristics, and evaluation of student success, in an online health education course. Unpublished doctoral dissertation, Nova Southeastern University, Fort Lauderdale, Florida. Retrieved January 26, 2002, from http://www.LTSeries.com/LTS/pdf_docs/dissertn.pdf
Dominguez, P. S., & Ridley, D. R. (2001). Assessing Distance Education Courses and Discipline Differences in their Effectiveness. Journal of Instructional Psychology, Mar2001, Vol. 28 Issue 1, p15, 5p
Dutton, J., Dutton, M., & Perry, J. (2001). Do Online Students Perform As Well As Traditional Students?. Submitted for publication North Carolina State University
Fallah, M. H., & Ubell, R. (2000). Blind Scores in a Graduate Test: Conventional Compared with Web-based Outcomes.ALN Magazine, Volume 4, Issue 2 – December.
Figueroa, M. L. (1992). Understanding Students Approaches to Learning in University Traditional and Distance Education Courses . Journal of Distance Education, 7(3), 15-28.
Frederickson, N., Reed, P., & Clifford, V. (2005). Evaluating Web-supported learning versus lecture-based teaching: Quantitative and qualitative perspectives. Higher Education 50 (4):645–64.
Fulmer, J., Hazzard, M., Jones, S., & Keene, K. (1992). Distance Learning: An Innovative Approach to Nursing Education. Journal of Professional Nursing - September-October; 8 (5) . pp. 289-294.
Gilliver, R. S., Randall, B., & Pok, Y. M. (1998). Learning in cyberspace: Shaping the future. Journal of Computer Assisted Learning 14 (3):212–22.
Green, R., & Gentemann, K. (2001). Technology in the Curriculum: An Assessment of the Impact of On-Line Courses. Online at: http://assessment.gmu.edu/reports/Eng302. George Mason University
Hairston, N. R. (2007). Employees’ attitudes toward e-learning: Implications for policy in industry environments. PhD Disseration, University of Arkansas, Fayetteville.
Harrington, D. (1999). Teaching statistics: A comparison of traditional classroom and programmed instruction/distance learning approaches. Journal of Social Work Education, 35, 343- 352.
Harris, J. M., Elliott, T. E., Davis, B. E., Chabal, C., Fulginiti, V., & Fine, P. G. (2007). Educating generalist physicians about chronic pain: Live experts and online education can provide durable benefits. Pain Medicine 9 (5):555–63.
Hiltz, S. R. (1993). Correlates of learning in a virtual classroom. International Journal of Man–Machine Studies, 39, 71–98.
Hoey, J. J., Pettitt, J. M., Brawner, C. E., & Mull, S. P. (1998). PROJECT 25: A Report on the Implementation of Courses Offered on the Internet as Part of Project 25 in the Fall Semester, 1997 , University Planning and Analysis. North Carolina State University
Hugenholtz, N. I. R., de Croon, E. M., Smits, P. B., van Dijk, F. J. H., & Nieuwenhuijsen, K. (2008). Effectiveness of e-learning in continuing medical education for occupational physicians. Occupational Medicine 58 (5):370–72.
Hughes, J.E., McLeod, S., Brown,R., Maeda, Y., & Choi, J. (2007) . Academic Achievement and Perceptions of the Learning Environment in Virtual and Traditional Secondary Mathematics Classrooms. The American Journal of Distance Education . Philadelphia: 2007. Vol. 21, Iss. 4; p. 199
Hurley, D. (1997). Online Sociology: Preliminary Research Report. Online: www.geocities.com/Athens/Parthenon/5824/study.html
Jamero, D. J., Borghol , A., & Mihm, L. (2009). Comparison of Computer-Mediated Learning and Lecture-Mediated Learning for Teaching Pain Management to Pharmacy Students. American Journal of Pharmaceutical Education. Alexandria: 2009. Vol. 73, Iss. 1; pg. 1, 5 pgs
Jang, K. S., Hwang, S. Y., Park, S. J., Kim, Y. M., & Kim, M. J. (2005). Effects of a Web-based teaching method on undergraduate nursing students’ learning of electrocardiography. The Journal of Nursing Education. 44 (1):35–39.
Jewett, F. (1997). SUNY Brockport and the SUNY Campuses in Western New York State: A Case Study in the Benefits and Costs of an Interactive Television Network Seal Beach, CA. , The Chancellor's Office California State University.
Johnson, M. (2002). Introductory Biology Online: Assessing Outcomes of Two Student Populations. Journal of College Science Teaching - February, XXXI, number 5, pp 312-317
Johnson, S. D., Aragon, S. R., Shaik, N., & Palma-Rivas, N. (2000). Comparative Analysis of Learner Satisfaction and Learning Outcomes in Online and Face-to-Face Learning Environments. Journal of Interactive Learning Research, 11(1). 29-49.
Johnson, S. M. (2001). Teaching Introductory International Relations in an Entirely Web-based Environment: Comparing Student Performance Across and Within Groups. Education at a Distance. January 2001. Vol. 15, No.1
Keene, D., & Cary, J. (1992). Effectiveness of distance education approach to US army reserve component training. In Distance Education for Corporate and Military Training, ACSDE Reserve Monograph No.3, 97-103. University Park, PA: The Pennsylvania State University American Center for the Study of Distance Education.
Kleinman, J., & Entin, E. B. (2002) . Comparison of in-class and distance-learning students' performance and attitudes in an introductory computer science course. The Journal of Computing in Small Colleges. 17(6).
Knowles, E. (1998). Milestone Report for the project: Curriculum Design, Production, and Delivery of MEA200 as a World-Wide Web Course. North Carolina State University
Kribs, H. D., & Mark, L. J. (1998). Distance Learning Technology Demonstration. The Naval Reserve Professional Development Center: Evaluation Report.
Leasure, A. R., Davis, L., & Thievon, S. L. (2000) . Comparison of student outcomes and preferences in a traditional vs. world wide web-based baccalaureate nursing research Course. Journal of Nursing Education 39(4): 149-154.
Logan, E., & Conerly, K. (2002). Students Creating Community: An Investigation of Student Interactions in a Web based Distance Learning Environment. Online Nov 2009: http://www.icte.org/T01_Library/T01_253.pdf
Logan, E., Augustyniak, R., & Rees, A. (1998). Distance Education as Different Education: A Student-centered Investigation of Distance Learning Experience. Florida State University
Long, L. W., & Javidi, A. (2001). A Comparison of Course Outcomes: Online Distance Learning Versus Traditional Classroom Settings. Retrieved April 28, 2003, from http://www.communication.ilstu.edu/activities/NCA2001/paper_distance_ learning.pdf
Long, M., & Jennings, H. (2005). “Does it work?”: The impact of technology and professional development on student achievement. Calverton, Md.: Macro International.
Maki, R. H., Maki, W. S., Patterson, M., & Whittaker, P. D. (2000). Evaluation of a Web-based Introductory Psychology Course: I. Learning and Satisfaction in on-line versus Lecture Courses. Behavior Research Methods, Instruments & Computers, 32, 230–239.
Maki, W. S., & Maki, R. H. (2002). Multimedia comprehension skill predicts differential outcomes of Web-based and lecture courses. Journal of Experimental Psychology: Applied 8 (2):85–98.
Maltby, J. R., & Whittle, J. (2000). Learning Programming Online: Student Perceptions and Performance. The ASCILITE 2000 conference proceedings.
Martin, E. D., & Rainey, L. (1993). Student Achievement and Attitude in a Satellite-Delivered High School Science Course. The American Journal of Distance Education - Vol. 7, No. 1. pp. 54-61.
Mehlenbacher, B., Miller, C. R., Covington, D., & Larsen, J. S. (2000). Active and Interactive Learning Online: A Comparison of Web-Based and Conventional Writing Classes. IEEE Transactions on Professional Communication, 43 (2), 166-184.
Mock, R. L. (2000). Comparison of Online Coursework to Traditional Instruction. Online: http://hobbes.lite.msu.edu/~robmock/masters/abstract.htm. Michigan State University - July 19
Murphy, T. H. (2000). An Evaluation of a Distance Education Course Design for General Soils. Journal of Agricultural Education 111 Vol. 41 Issue 3, 2000
Navarro, P., & Shoemaker, J. (1999). The Power of Cyberlearning: An Empirical Test. Journal of Computing in Higher Education. Volume 11, Number 1. October 1999. ISSN 1042-1726
Navarro, P., & Shoemaker, J. (1999b). Economics in Cyberspace: A Comparison Study. University of California - Irvine, Graduate School of Management. pp. 33.
Nesler, M. S., Hanner, M. B., Melburg, V., & McGowan, S. (2001). Professional Socialization of Baccalaureate Nursing Students: Can Students in Distance Nursing Programs Become Socialized? Journal of Nursing Education, 40 (7): 293-302
Ngu, B. H. (2002). Online Instruction Versus Face-to-Face Instruction At Universiti Malaysia Sarawak International. Journal of Educational Technology.
O’Dwyer, L. M., Carey, R., & Kleiman, G. (2007). A study of the effectiveness of the Louisiana Algebra I online course. Journal of Research on Technology in Education 39 (3):289–306.
Padalino, Y., & Peres, H. H. C. (2007). E-learning: A comparative study for knowledge apprehension among nurses. Revista Latino-Americana de Enfermagem 15:397–403.
Pelletier, J. Y., Ness, G. W., & Murphy, R. J. L. (2001). Problem-Based Learning Using Web-Based Group Discussions: A Positive Learning Experience for Undergraduate Students. Acadia University. Canada
Redding, T. R., & Rotzien, J. (2001). Comparative Analysis of Online learning versus Classroom learning. Journal of Interactive Instruction Development, 13 (4), 3-2. v
Rensselaer Polytechnic Institute (1997). A Case Study in the Benefits and Costs of a joint Industry/University Designed Program Featuring Integrated Delivery Methods. Rensselaer Polytechnic Institute. Online: https://www.calstate.edu/special_projects/mediated_
Ross, J. (2000). An Exploratory Analysis Of Student Achievement Comparing A Web-Based And A Conventional Course Learning Environment , University of Calgary. A Report for the Office of Learning Technology February, 2000
Ruchti, W. P., & Odell, M. R. L. (2000). Comparison and Evaluation of Online and Classroom Instruction in Elementary Science Teaching Methods Courses. Paper presented at the Northern Rocky Mountain Educational Research Association Conference, Jackson Hole, Wyoming.
Ryan, R. C. (2000). Student Assessment Comparison of Lecture and Online Construction Equipment and Methods Classes. T.H.E. Journal - Volume 27, Number 6, January.
Sandercock, G. R. H. (1999). Learners' Performance and Evaluation of Attitudes Towards Web CourseTools in the Delivery of an Applied Sports Science Module. ALN Magazine Volume 3, Issue 2 - December 1999
Sankaran, S. R., Sankaran, D., & Bui, T. X. (2000). Effect of student attitude to course format on learning performance: An empirical study in Web vs. lecture instruction. Journal of Instructional Technology, 27, 66–73.
Schaik, P., Barker, P., & Beckstrand, S. (2003) . A Comparison of On-Campus and Online Course Delivery Methods in Southern Nevada. Innovations in Education and Teaching International 40(1): 5-15.
Schoenfeld-Tacher, R., McConnell, S., & Graham, M. (2001). Do no harm: A comparison of the effects of online vs. traditional delivery media on a science course. Journal of Science Education and Technology 10 (3):257–65.
Schulman, A. H., & Sims, R. L. (1999). Learning in an Online Format versus an In-class Format: An Experimental Study. T.H.E. Journal - Vol 26, No.11 June Nova Southeastern University pp.54-56.
Smeaton, A., & Keogh, G. (1999). An Analysis of the Use of Virtual Delivery of Undergraduate Lectures. Computers and Education - Vol. 32. pp. 83-94.
Smith, T. L., Ruocco, A., & Jansen, B. J. (1999). Digital video in education. ACM Computer Science Education Conference, New Orleans, LA., 122-126
Souder, W. E. (1993). The Effectiveness of Traditional versus Satellite Delivery in Three Management of Technology Master's Degree Programs. The American Journal of Distance Education. Vol. 7, No. 1, pp. 37-53.
Sun, K., Lin, Y., & Yu, C. (2008). A study on learning effect among different learning styles in a Web-based lab of science for elementary school students. Computers & Education 50 (4):1411–22.
Suter, W. N., & Perry, M. K. (1997). Evaluation by electronic mail. Paper presented at the annual meeting of the Mid-South Educational Research Association, Memphis, Tenn.. (ERIC Document Reproduction Service No. ED415269).
Tesone, D. V., Alexakis, G., & Platt, A. (2003) . Distance learning programs for non-traditional and traditional students in the business disciplines. Online Journal of Distance Learning Administration 6 (4).
Thielke Huff, M. (2000). A comparison study of live instruction versus interactive television for teaching MSW students critical thinking skills. Research on Social Work Practice; Thousand Oaks.
Tucker, S. (2001). Distance Education: Better, Worse, Or As Good As Traditional Education? Online Journal of Distance Learning Administration, Volume IV, Number IV, Winter 2001
Turner, M. K., Simon, S. R., Facemyer, K. C., Newhall, L. M., & Veach, T. L. (2006). Web-based learning versus standardized patients for teaching clinical diagnosis: A randomized, controlled, crossover trial. Teaching and Learning in Medicine 18 (3):208–14.
Umble, K. E., Cervero, R. M., Yang, B., & Atkinson, W. L. (2000). Effects of traditional classroom and distance continuing education: A theory-driven evaluation of a vaccine-preventable diseases course. American Journal of Public Health; Washington;
Urban, C. Q. (2006). The effects of using computer-based distance education for supplemental instruction compared to traditional tutorial sessions to enhance learning for students at-risk for academic difficulties. PhD Dissertation, George Mason University, Fairfax, Va.
Wallace, P. E., & Clariana, R. B. (2000). Achievement predictors for a computer-applications module delivered online. Journal of Information Systems Education 11 (1/2):13–18.
Wang, L. (2008). Developing and evaluating an interactive multimedia instructional tool: Learning outcomes and user experiences of optometry students. Journal of Educational Multimedia and Hypermedia 17 (1):43–57.
Waschull, S. B. (2001). The online delivery of psychology courses: Attrition, performance, and evaluation. Teaching of Psychology, 28, 143– 147
Weems, G. H. (2002). Comparison of Beginning Algebra Taught Onsite versus Online. Journal of Developmental Education 26(1): 10-18.
Wegner, S. B., Holloway, K. C., & Garton, E. M. (1999). The effects of Internet-based instruction on student learning. Journal of Asynchronous Learning Networks. 3 (2) November 1999.
WESTNET Program (1997). The WESTNET Program —SUNY Brockport and the SUNY Campuses in Western New York State: A Case Study in the Benefits and Costs of an Interactive Television Network. Seal Beach, CA: The Chancellor’s Office, California State University
Wisher, R. A., & Priest, A. N. (1998). Cost-effectiveness of Audio Teletraining for the US Army National Guard. The American Journal of Distance Education, Vol. 12, No.1 38-51
Zacharia, Z. C. (2007). Comparing and combining real and virtual experimentation: An effort to enhance students’ conceptual understanding of electric circuits. Journal of Computer Assisted Learning 23 (2):120–32.
|