|
 |
MERLOT Journal of Online
Learning and Teaching |
Vol.
6, No. 3, September 2010
|
Making Learning Visible: Using E-maps to Enhance Critical Reading Skills
Desarrollando un Aprendizaje Visible: Utilizando Mapas Electrönicos
para Incrementar las Destrezas Lectoras Crïticas
|
Aziza R. Ellozy
Director, Center for Learning and Teaching
Associate Dean of Learning Technologies
American University in Cairo
New Cairo 11835 Egypt
aellozy@aucegypt.edu
|
Hoda M H Mostafa
Associate Professor of Ophthalmology
Cairo University
Adjunct Associate Professor
American University in Cairo
Cairo, Egypt
hodamostafa@aucegypt.edu
|
|
Abstract
Research suggests that the use of concept maps enhances learning transfer and retention. This paper presents a case study on the use of a hybrid concept/mind mapping online strategy (E-mapping) to develop critical reading skills in first year Egyptian students enrolled at the American University in Cairo. Seventy students participated in the study and data were collected over two semesters. E-maps and assignment-specific rubrics were used to assess learning. Student feedback was collected via early and late semester surveys and a mid-semester assessment. Results show that E-mapping is a potentially powerful active learning tool which goes beyond developing strong reading skills and enhancing class participation. It enhances critical thinking and helps students acquire visualization skills by which they can communicate ideas using imagery. It is also an assessment tool that permits instructors to gain insight into their students’ analytical and synthetic skills. Although the majority of students in this study recognized the benefits of E-mapping, many of them found it a time consuming approach and believed it represented too much work.
Key words: concept maps, visual thinking, active learning, e-learning, E-mapping, critical thinking |
Resumen
La investigación sugiere que el uso de mapas de concepto incrementa la transferencia y retención del aprendizaje Este documento presenta el estudio de un caso sobre el uso de una estrategia del concepto híbrido/planimetría intelectual online (planificación de programas E) para desarrollar habilidades de lectura durante el primer año de estudiantes Egipcios que se matricularon en la American University en Cairo. Setenta estudiantes participaron en el estudio y se recolectaron datos durante dos semestres. Se utilizaron mapas – e y rúbricas de tareas-específicas para evaluar el aprendizaje. La retroalimentación estudiantil fue recopilada a través de exámenes al inicio y al término del semestre y una evaluación a mediados del semestre. Los resultados indican que la planimetría-E es una herramienta potencialmente poderosa y activa en el aprendizaje que va más allá de desarrollar potentes habilidades de lectura y acrecentar la participación en clases. Ésta incrementa el pensamiento crítico y ayuda a los estudiantes a adquirir habilidades visuales mediante las cuales se pueden comunicar utilizando imágenes. A la vez es una herramienta de evaluación que permite a los instructores obtener claridad sobre las habilidades sintéticas y analíticas de sus estudiantes. A pesar de que la mayoría de los estudiantes en este estudio reconocieron los beneficios de la planimetría-E, muchos de ellos encontraron que demandaba mucho tiempo y consideraban que representaba demasiado trabajo.
Palabras claves: mapas de concepto, pensamiento visual, aprendizaje activo, aprendizaje-electrónico, planimetría-E, pensamiento crítico. |
Introduction
One of the most common complaints of professors teaching freshmen is that students rarely read the assigned texts, and when they do, they often do not understand the reading on their own and expect instructors to analyze it for them (Brent and Felder, 1996) for a deeper more critical understanding of the topics discussed. Other studies suggest that critical reading skills are often weak at the undergraduate level and requires the implementation of specific techniques to develop ( Chamberlain & Burrough, 1985). The literature is replete with strategies that have been proposed to address this problem: some instructors require students to write summaries or questions about the reading (Hendersen & Rosenthal, 2006), others use graphing techniques for reading and learning enhancement (Chmielewski & Dansereau, 1998), while still others (Marcell, 2008) use online quizzes to test the assigned reading material.
At the American University in Cairo (AUC), where the authors teach, the freshmen students are no exception to this occurrence. In addition, because they are predominantly Egyptians, the majority speak English as a second language and many of them may be minimally proficient at reading and writing scientific texts.
The context for this case-study on the implementation of E-mapping as a critical reading strategy is Scientific Thinking, a core curriculum course required for all students at the AUC, which is an institution that provides an education strongly grounded in the traditional liberal arts and sciences. Scientific Thinking aims to develop a broad understanding of the scientific method, and one of the objectives of the course is to cultivate the habits of mind characteristic of a scientific approach to the world. The importance of the use of observable empirical data through experimentation and observation as well as the value of various forms of evidence, are highlighted. E-maps would be useful in helping students identify relevant information within assigned texts.
The course is structured around a series of general lectures provided to all students in an auditorium by AUC faculty and visiting lecturers. Small class sessions follow including discussions and activities aimed at reinforcing the themes covered during the lecture. Students are assigned a number of selected texts for each topic to which they have online access through WebCT (currently Blackboard), the course management system. Students are instructed to come to class prepared for discussions or for class activities based on the assigned texts. Many students come to class unprepared to actively discuss assigned texts and unable to contribute in class activities.
Faced with this problem, the authors of this paper tried various techniques in the past including Eric Mazur’s reading quiz strategy (1997) which consisted of giving a 3-5 minute reading quiz at the start of each class to encourage pre-class reading and to check if students had a basic understanding of the material.
Although the students were more prepared, the result of this approach did not reflect the level of critical reading expected of freshmen. Students were unable to identify the main ideas within the text, analyze or critique an argument. They were also unable to recognize purpose or bias within the text.
This paper investigates the use of the hybrid concept/mind mapping online technique to enhance text comprehension and to develop critical reading, as well as increase class participation in the Scientific Thinking course. The aim was to explore the potential of such a technique for enhancing the quality and quantity of interaction with text and among students and instructors. The research was completed in Spring 2008.
Background and Method
Of the several reading strategies that are successful, graphic strategies provide readers with visual approaches to reading that are different from traditional, linear text presentation (Chang et al, 2002). The authors decided to try concept mapping and mind mapping as the graphical strategy that would help enhance text comprehension and lead to more meaningful information retention.
Concept maps were first introduced by Novak and his colleagues at Cornell in the 1960s as a means to visually represent relationships among concepts. Concept maps consist of terms, concepts or nodes of information usually embedded in boxes connected by directional links between the nodes with arrows and/or linking phrases (Figure 1.)
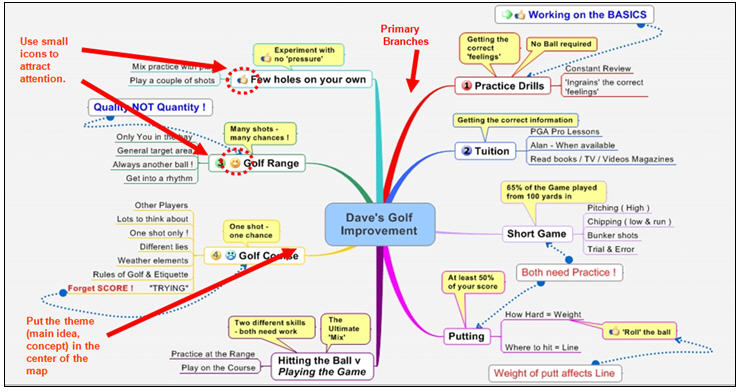
Mind mapping, on the other hand, introduced in the 1960s by Buzan, is a graphical technique of taking notes or representing thoughts or ideas in a visual manner. While concept maps may have many ideas, mind maps are structured around one central concept, word or idea, with branches and sub-branches of related ideas. Both mapping techniques highlight links among concepts, and mind maps are usually highly visual including pictures and colors as well as other visual prompts (see Figure 2, Figure 3). Both methods are based on an adaptation of constructivism, an epistemology which regards learning as a unique sense-making and knowledge construction activity that happens as the result of the person’s interaction with the world around him/her, in terms of texts, objects, and people. This focus on the uniqueness of knowledge construction acknowledges the influence of learners’ individual characteristics, prior knowledge, needs, and goals in that construction, and the importance of providing individuals with scaffolds that help them bridge the ‘zone of proximal development’ (Duffy, 2002) .
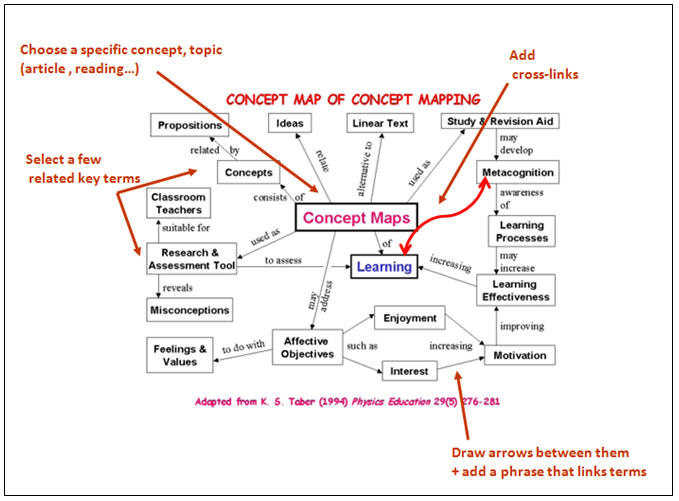
Figure 1. Concept map of how to construct a concept map.
In studies involving different disciplines and age groups, the use of concept maps was associated with increased knowledge transfer and retention (Nesbit & Adesope, 2006), ( Romance & Vitale, 1999). It was decided to introduce these tools to encourage in-depth, pre-class reading as preparation for in-class discussion. The authors used a hybrid approach to mapping to integrate the powerful visual cues of mind mapping into concept maps. Visual cues included icons indicating positive or negative value and icons reflecting various degrees of importance such as a “thumbs-up” sign. For the purpose of this paper, the technique will be referred to as “E-mapping” (Ruffini, 2008). E-mapping was incorporated into the syllabus of three Scientific Thinking sections over two semesters, with the goal of developing critical reading and better class participation in face-to-face class discussions. Since concept maps had also been successfully used as assessment tools (Walker & King, 2003, Stoddart et al, 2000), another goal was to identify how students think and how they organize their ideas. This latter information can guide instructors in identifying and correcting students’ misconceptions and help to resolve the conflict between their prior knowledge, personal theories and new information found in the reading texts.
The E-mapping technique was gradually introduced as most students had not used it before. The authors anticipated that some students would experience difficulty translating linear text into nonlinear graphic representation as this was a different approach for them. At first, a short in-class reading was given to them and they were asked to practice the technique/strategy by sketching a concept map by hand. They were then asked, as a class, to brainstorm and work out a map on the board.
After an initial pen and pencil introduction, all students were introduced to the free online “Mindomo” software. This is a versatile web-based mind mapping tool that runs in a Web browser, with the maps being stored on Mindomo server. No complex software need be installed or maintained; only a Web browser with a Flash player is needed. Everything a user needs from basic desktop software is available: rich formatting, curved lines, images and symbols, relationships, notes fields, task data, drag and drop editing, and Web hyperlinks. Computer generated maps offer many advantages over paper and pencil including the option of altering maps easily, inserting images and hyperlinks, saving the map as an image or PDF file, and a wide variety of other options. Students can create group accounts allowing online collaboration where they can work on more complex tasks requiring group work. By making their maps public, the work can be viewed by classmates and discussed in class.
Assignments
In this study, the students were given three types of assignments of increasing difficulty:
-
Design an E-map for some of the assigned weekly readings.
-
Create an E-map as a summary to the weekly “general” lectures .This was a more demanding exercise. They had to revise notes and listen to recorded audio files of the lecture as well as collaborate with peers to produce a group map.
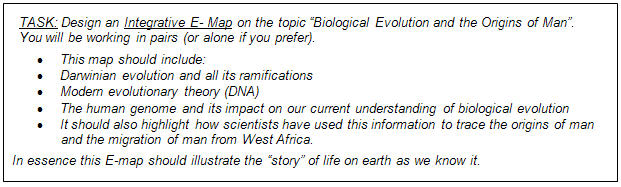
- Create an E-map for a broad topic such as the following example:
Step-by-step PowerPoint presentations were used in class to show students how to create, save, export and print their maps. These presentations were made available online for review. An additional workshop was arranged for students having difficulty with the concepts introduced in class.
Assessment
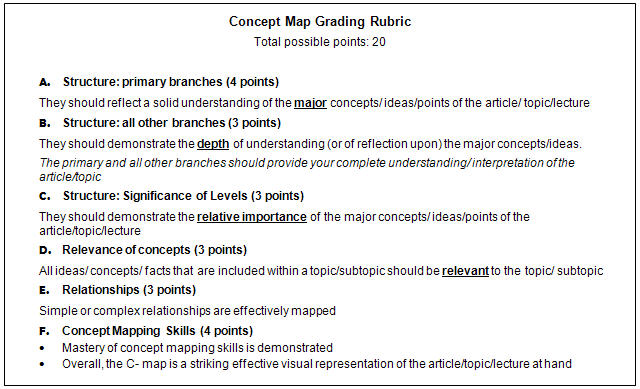
Students were assessed using a rubric that the authors developed based on preliminary analysis of early maps. Students were given the rubric which spelled out for them how the quality of their analysis and interpretation would be translated to a grade. The rubric is shown in Table 1.
Table 1. E-map Grading Rubric.
Participants and Data Collection
The participants consisted of 70 students enrolled in three sections of the 100-level Scientific Thinking course. The authors were the instructors and data were collected over two semesters. The data collected consisted of student E-maps, early and late semester anonymous surveys, and a mid-semester small group instructional diagnosis (SGID) (White, 2008).
Surveys
An early semester survey was conducted four weeks into the semester after students had submitted a simple hand-drawn concept map based on a 500 word newspaper article followed by a computer generated E-map of a reading. By then, students had attended two classes introducing E-mapping and Mindomo software The following five statements were included in the survey:
I now understand the basic principles of concept mapping
-
I was able to use Mindomo software easily
-
On average I spent…less than 30 minutes, 30-60 minutes, more than 60 minutes. on the assigned concept map
-
Concept mapping helped me identify the main ideas in the reading
-
Concept mapping required me to look at the reading in more depth
The same survey was administered at the end of the semester to see if there were any differences in students’ perceptions regarding the use of E-mapping.
b) Small Group Instructional Diagnosis (SGID)
Students also participated in a mid-semester SGID session conducted in the absence of the instructor by trained facilitators from the Center for Learning and Teaching (CLT) at the American University in Cairo. The facilitators informed the students that the SGID is a method for collecting feedback for purposes of improving their learning experience during the course and not an evaluation of the teacher, thus encouraging a candid and safe discussion. This SGID allowed the instructor to use student feedback to adapt the course later during the semester and in subsequent semesters. For the SGID, participants were divided into groups of three to four students and were asked the following two questions:
What helps you learn in this course?
-
What improvements would you like and how would you suggest they be made?
Each group was to reach a consensus for the questions asked and to record and submit their answers during the SGID. After sharing the answers, the CLT facilitators conducted a short discussion to ensure clarification and consensus. In this particular case, an emphasis was placed on the E-mapping activity.
c) Student E-maps Maps were graded and detailed feedback was given to students based on the rubric provided. Students were expected to use the rubric to construct E-maps that outlined the main themes in the reading as well as learn to separate ideas under the main themes. They were also expected to identify purpose as well as bias, and to use appropriate visual icons.
Results and Discussion
Strengths of E-mapping
The authors’ original goal was to ensure that pre-class reading was done in-depth and that active class participation in the discussion followed. Students responded favorably to simple mapping tasks and a detailed rubric was designed (see Table 1) which guided them through a more rigorous critical reading approach requiring students to identify the main ideas in the text, to identify purpose and to analyze an argument. A summary of the benefits of the method follows.
Students actually read the text and the in-class discussions were much more meaningful with more students participating.
Students were forced to read the text critically . Figure 3 is an example of an E-map that students had to draw for an assigned reading entitled Scientific Thinking and the Scientific Method ( Schafersman, 1997). The basic mapping strategy was to have students convert linear text into a non-linear graphic representation. This exercise was especially useful for our freshmen students who are used to thinking and studying in a linear manner. This is often considered a by-product of local curricula and traditional teaching methods, of assessment techniques that deemphasize high-order thinking skills such as synthesis and evaluation, and of limited English reading ability for many Egyptian speakers of English as a second language. The method required them to represent the article as a whole and to visually demonstrate relationships between concepts or ideas.
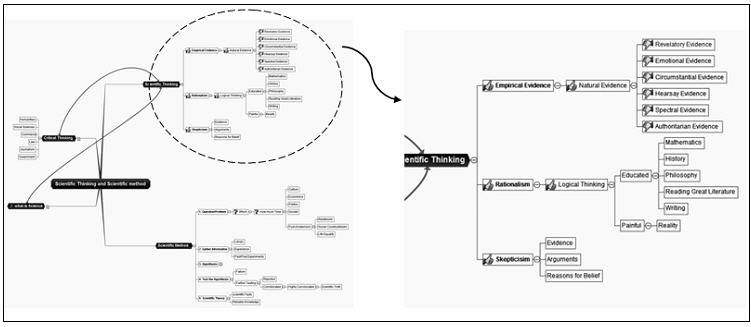
Figure 3. Example of an early E-map of a reading assignment with a section magnified.
In the example of Figure 3, the student was able to highlight the four main ideas of the article, to demonstrate the relative importance of the major concepts and to use the visual cues of thu mbs up or down to interpret meaning. Simple relationships were also effectively mapped through connecting arrows from an assigned reading that was to be discussed later in class. This basic map was considered a good starting point. An average freshman student would be expected to achieve this level of proficiency/understanding.
Figures 4A and 4B are two examples of E-maps of a General Lecture presentation by an invited speaker. The topic was “Who are the greatest scientists of all time?” Although both are well organized, the differences in detail, organization and structure are very apparent. In Figure 4A, the relative importance of ideas is indicated but is not very distinctive, and relationships are not mapped. In Figure 4B, simple and complex relationships are very effectively mapped and the non-linear structure provides a very complete picture of the lecture content. In addition, the student who mapped Figure 4B made very effective use of the visual elements of the mind mapping software (different ideas were grouped according to different colors and shape). Visual symbols added interpretive meaning (see Figure 5B) where icons indicating positive or negative significance could be included. This added another level to the map requiring students to interpret the concepts within the text one step further within the space constraints required to construct E-maps.
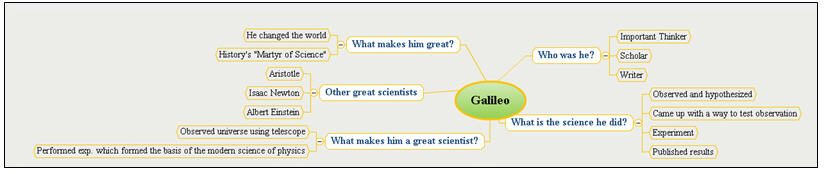
Figure 4A. One student’s E-map of a lecture.
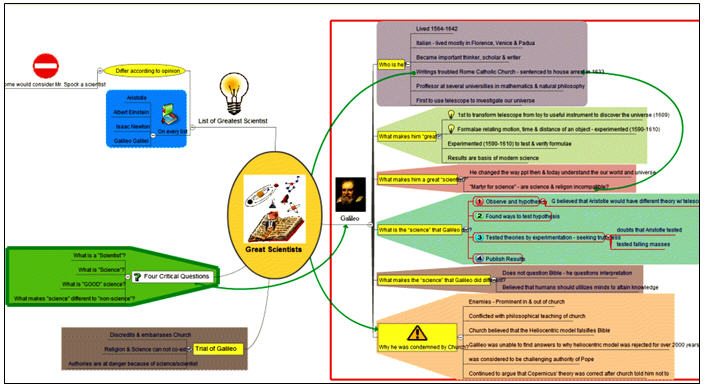
Figure 4B. Another student’s E-map of the same lecture.
E-maps provide insights into learners’ unique knowledge construction, and no two maps are ever the same . This is where the strength of E-mapping lies:
a) No two maps can ever be the same. This aligns well with constructivist theory - learning is a unique construction and scaffolding is needed within the individual learner’s zone of proximal development. The value of these maps is in the insight they provide on an individual’s learning process.
b) They provide immediate visual data on a student’s perceptions or misperceptions, providing prompt feedback on his/her understanding.
E-maps are a window into students “thinking” providing a catalyst.
Figures 5A and 5B are E-maps of Karl Popper’s article Heroic Science (Popper, 1974). Most students complained that the article was difficult. Yet, for most of them, the E-maps revealed that they had understood it, and the in-class discussion was productive. Had they simply been assigned to read it, they would have abandoned it and come unprepared to class relying on the professor’s explanation.
Examining those two E-maps shows how an instructor can perceive the different analytical skills of students, and how one can “read” their interpretation (or misinterpretation) of the article. By noting how students map out key concepts and whether they include descriptive icons or arrows to link concepts, an initial appraisal of the student’s grasp of the material can be made. Students who fail to see the connection between concepts or fail to include a piece of relevant information are usually misinterpreting the reading material or failing to grasp the key concepts.
Figure 5A is the E-map of a student with poor analytical skills who used the non-linear structure of the map to weave in a narrative. In that case, linear thinking is forced in the non-linear packaging of an E-map. The ability to distinguish the relative importance of ideas/concepts seems to be lacking and so is the ability to find correct relationships among the various ideas in the text. (Note that there are 32 primary branches and very few secondary branches reflecting an inability to identify the main themes of the text) On the other hand, Figure 5B (an E-map of the same article) shows that the student can distinguish very clearly the significant and relevant ideas and has used visual cues effectively to reinforce a correct interpretation of the article.
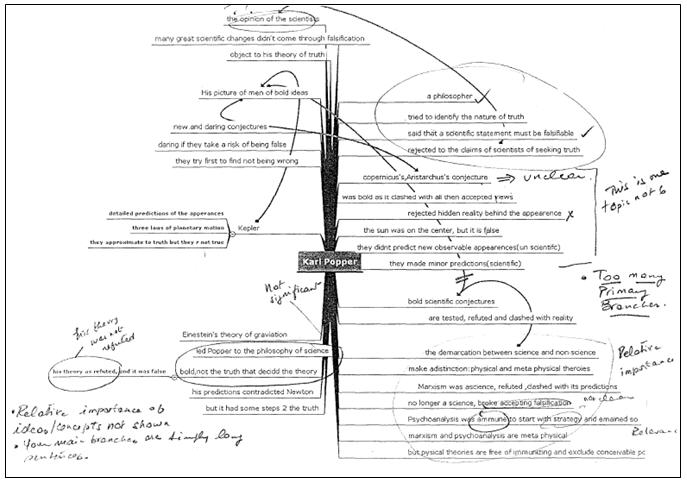
Figure 5A. A student’s E-map revealing poor analytical skills.

Figure 5B. Another’s student’s E-map of the same article.
E-maps develop students’ synthesis skills taking knowledge construction to a different level.
The next two E-maps (Figures 6 and 7) illustrate a different type of assignment and/or exam question (on an exam they used pencil and paper). In this approach, students did not have the scaffolding afforded by a specific article or lecture. They were asked to draw an E-map of a broad open-ended topic which they had discussed in class. Their sources were lectures, articles and websites. This approach called upon their synthesis skills and challenged them to present a coherent overall picture of the topic at hand.
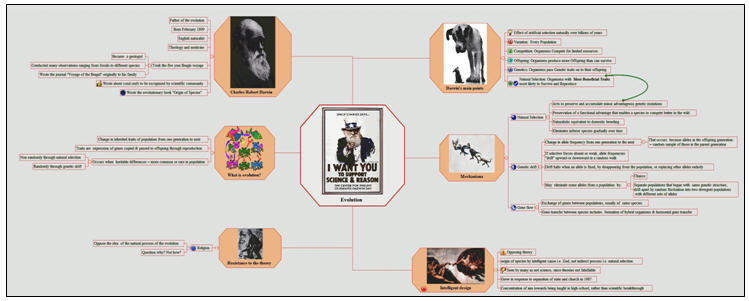
Figure 6. E-map on “Biological evolution.
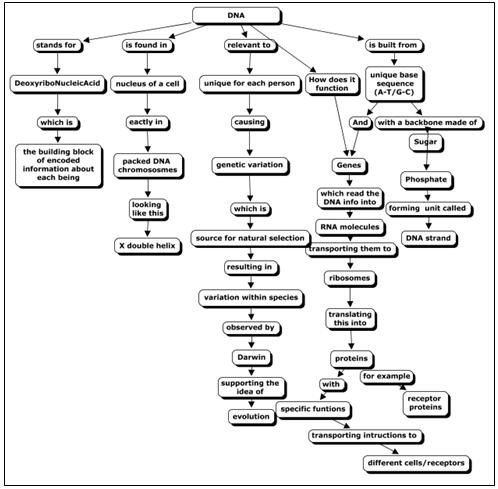
Figure 7. Computerized rendition of a student’s pencil and paper concept map
about the DNA molecule
Figure 7 is a computerized rendition of a student’s pencil and paper concept map in an in-class exam question. They were asked what they knew about the DNA molecule and its connection to broader topics. This type of E-map is the more traditional way of using maps to assess knowledge, where students filled in the answers in spaces provided, versus the more complex task of constructing an E-map on their own based on assigned text.
Students’ Reaction to E-mapping
Survey results
Figures 8-13 compare the cumulative results of two surveys, discussed in the methods section, given to the three sections over two semesters. The first one was an early semester survey (ESS) and the other was a late semester survey (LSS). From Figures 8 and 9, one can conclude that a majority of students find the Mindomo software easy to use and that they understand the basic principles of concept mapping. At the end of the semester more students strongly agreed to these two statements than at the beginning (49.0% vs. 34.7% and 46.7% vs. 28.3% respectively). Also, on the whole they were spending more time on E-maps at the end of the term than at the beginning (Figure 10), mostly because the assignments were more open-ended integrative projects requiring more research and time.
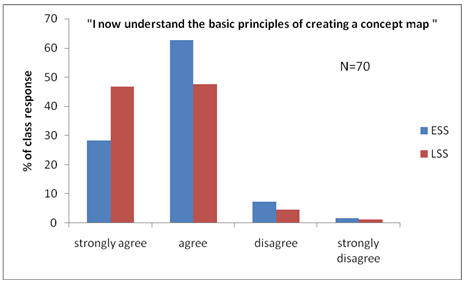 |
Figure 8. Student response to survey question #1.
|
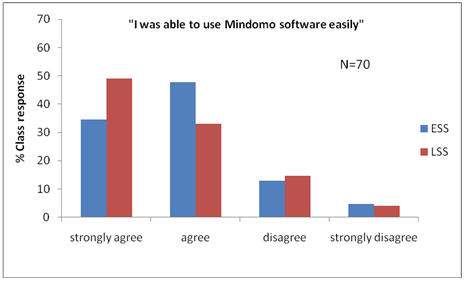 |
Figure 9. Student response to survey question #2.
|
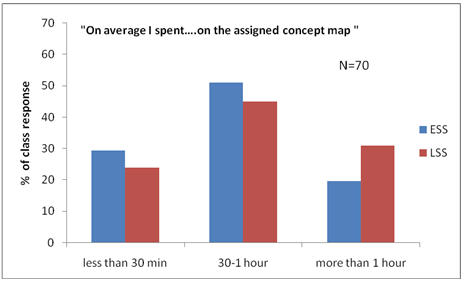 |
Figure 10. Student response to survey question #3. |
In addition, a majority of students agreed or strongly agreed that the E-mapping exercise helped them identify the main ideas in the reading (Figure 11), and at the end of the semester the percentage increased from 59.7% to 66.3%. However the percentage of those who disagreed went up from 5.3 to 10.7%. This may be explained by a number of students who were initially neutral and who then shifted to either agreeing or disagreeing.
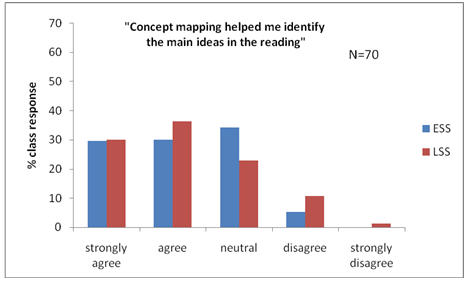 |
Figure 11. Student response to survey question #4 . |
In answer to the last question (Figure 12), although a majority of students still strongly agreed/agreed (73.7% and 71.3%) that concept mapping required more in-depth reading, those who disagreed went up from 4.3 to 9% and 4% strongly disagreed. This may also be explained in the same manner with neutral students changing their opinion as the course progressed.
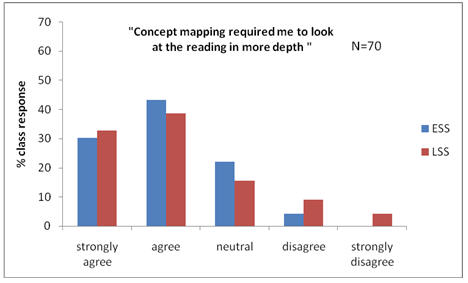 |
Figure 12. Student response to survey question # 5. |
Feedback from SGID
It should be remembered that the SGID is administered mid-semester and is meant for formative assessment purposes only. Therefore, it is not expected to mirror the results of the early and late semester surveys.
When asked what helped them learn in the course, students’ responses varied in the three classes surveyed. Regarding E-maps, four out of the six groups surveyed in one class claimed that “E-maps helped them understand the readings better,” “were useful for complex articles” and “helps me to understand the whole passage as I will have to highlight the main points.”
In the same class three out of the six groups said that they had “too many concept maps” or “too many concept maps for a 100 level course.” Individual feedback during free discussion revealed some resistance to the extra time and effort required to create an E-map for readings, especially when they compared their workload with the other 16-20 other sections of the course. In another class surveyed, three out of six groups claimed that they “liked concept maps but thought they were too much work” and two groups reported that they thought the software was not “user friendly.” This might have been the reason for the decreased satisfaction by the end of the semester. Two groups also reported that concept maps “helped them learn.” However further studies are needed to verify and explore students’ concerns about concept maps.
On the whole, the SGID results showed that students seemed to recognize the benefit of the E-maps but strongly reacted to the workload in general. It is worth noting that in response to this feedback, the number of E-maps was reduced. Weekly individual E-mapping assignments were replaced by E-maps incorporated into take-home portions of exams. E-maps requiring additional effort and synthesis skills were given as mini-projects toward final exams.
Conclusions
From this case study, we concluded that E-mapping is a potentially powerful learning tool. When coupled with an accompanying rubric, students learn to distinguish between important and less important information, learn to search for connections among what they read, what they know, and identify the different concepts of the course.
Furthermore, when they use the E-mapping technique to represent open-ended topics, students’ synthesis and analytical skills are enhanced. In particular, E-mapping assignments give them the chance to express themselves individually and in groups. For many of them, this was an opportunity to be visually creative given that computer generated maps allow the insertion of images, symbols, notes and hyperlinks.
E-mapping also proved to be a powerful assessment tool. It allowed instructors to glimpse into their students’ thinking processes and to gain insight into their students’ analytical and synthesis skills. It provided immediate visual data on the quality of a students’ interpretation of text.
Although the majority of students agreed that E-mapping “required them to look at the reading in more depth” and helped them identify the main ideas, many of them found E-mapping a time consuming approach to reading and represented too much work.
E-mapping is by no means a unique way of testing or evaluating content or critical thinking, but it is a powerful active learning strategy. In addition, it allows students to acquire good visualization skills by which they can communicate ideas using imagery, a recognized important 21 st century skill.
Acknowledgment
The authors would like to thank the Center for Learning and Teaching at the American University in Cairo for their help in conducting the surveys and the Small Group Instructional Diagnosis (SGID).
|
References
Brent, R, and Felder, R.M. (1996). Navigating the bumpy road to student-centered instruction. College teaching 44. Retrieved from http://www.jstor.org/stable/27558762
Chang, K., Sung, Y., & Chen, I. (2002). The effect of concept mapping to enhance text comprehension and summarization. The Journal of Experimental Education, 71 (1), 5 – 23.
Chamberlain, K., & Burrough, S. (1985). Techniques for teaching critical reading. Teaching of Psychology, 12(4), 213-215.
Chmielewski, T, & Dansereau, D.F. (1998). Enhancing the recall of text: Knowledge mapping training promotes implicit transfer. Journal of Educational Psychology. 90, 407-413.
Duffy, T. M. (2002). Learning through inquiry. Instructional text for the Learning to Teach with Technology Studio, Center for Research on Learning and Technology, Indiana University.
Hendersen, C, & Rosenthal, A. (2006). Reading questions: Encouraging students to read text before coming to class. Journal of College Science Teaching. 35. Retrieved from http://homepages.wmich.edu/~chenders/Publications/ReadingQuestions2005.pdf
Marcell, M (2008). Effectiveness of regular online quizzing in increasing class participation and preparation. International Journal for the Scholarship of Teaching and Learning, 2, Retrieved 08/22/2008, from http://academics.georgiasouthern.edu/ijsotl/v2n1/articles/Marcell/index.htm
Mazur, E. (1997). Peer Instruction: A User's Manual, Prentice Hall.
Nesbit, J. C., & Adesope, O. O. (2006). Learning with knowledge and concept maps: A meta-analysis. Review of Educational Research. 76 (3), 413-448.
Popper, K. (1974). Heroic science. In E. B. Bolles (Ed.),Galileo's commandment (pp. 41-49). Henry Holt.
Romance, N. R. & Vitale, M. R. (1999). Concept mapping as a tool for learning. College teaching. 47.
Ruffini, M. (2008). Using E-maps to organize and navigate online content. EDUCAUSE Quarterly. 31, 56-61.
Stoddart, T, Abrams, R, Gasper, E, & Canaday, D (2000). Concept maps as assessment in science inquiry-a report of methodology. Int. J. Sci. Educ., 22 (12), 1221-1246.
Walker, J. M., & King, P. H. (2003). Concept mapping as a form of student assessment and instruction in the domain of bioengineering. Journal of Engineering Education, Retrieved from http://www.vanth.org/docs/010_2002.pdf
White, K Mid-Course Adjustments: Using Small Group Instructional Diagnoses. Assessment in and of Collaborative Learning : A handbook of strategies, Retrieved from http://www.evergreen.edu/washcenter/resources/acl/c4.html
|
|
|
|
|
|
|