The Effect of Time Online on Grades in Online Sociology Courses
|
Igor Ryabov
Assistant Professor
Department of Sociology
University of Texas-Pan American
Edinburgh, TX 78539 USA
ryabovi@utpa.edu
Abstract
Throughout the past decade, web-based teaching and learning have experienced tremendous growth. Yet, research aimed at evaluating determinants of student learning outcomes in online courses is lagging behind. The majority of studies of online student participation have focused on the use of discussion board or other common communication areas. Little attention has been paid to the role time spent online plays in affecting academic performance of college students. The objective of this study was to estimate the relative importance of time spent online, prior grades, and demographic characteristics of students in terms of their academic performance in online sociology courses. Using a multinomial logistic model, the current study examined the odds of attaining one grade versus another depending on the amount of effort and controlling for gender, major, and year in school. Results suggest that among the effects examined in the study, time spent online and previous achievement matter the most.
Keywords: study time, online learning, student achievement, sociology, multinomial logistic regression
|
Introduction
Distance education, especially online education, continues to expand with no signs of slowing (Allen & Seaman, 2010). At the same time, there has been considerable controversy about the effectiveness of online learning. Supporters of online learning argue that learner participation can be significantly enhanced by using computerized media (Garrison & Anderson, 2003; Kearsley, 2000), while their opponents raise concerns about the quality of online courses (Garrett, 2004; Oliver, 2005). The intention of the present paper is not to engage in this debate; however, the findings of the study reported here may help illuminate the role of student participation in achieving a better grade. In this study, the level of student online participation was measured as time students spent in the learning environment. The aim was to estimate the effect of time students spent online on their grades, while controlling for student demographic characteristics and prior achievement. The study used multinomial logistic regression to model the effect of the aforementioned variables on the probability of moving from one letter grade to another. Unlike prior research that has almost exclusively relied on ordinary least squares (OLS) for estimation of students' grades, the present study used multinomial logistic regression with five different categories (grades A, B, C, D, and F). This approach was not only more appropriate for ordinal variables such as course grades, but also provided additional information not obtainable through OLS regression. In particular, the multinomial logistic regression allowed for quantifying the effect of getting a certain grade per unit of time.
Another point that distinguishes this study from prior research is that it involved the analysis of actual rather than self-reported data on student online activities. The majority of previous studies that have examined proximate determinants of students' achievement have relied on self-reported amount of study time (cf. Darren, Dixon, Stansal, Gelb, & Pheri, 2008; Lahmers & Zulauf, 2000; Hinrichsen, 1972; Rau & Durand, 2000; Schuman, Walsh, Olson, & Etheridge, 1985), which is biased and subject to substantial underreporting (Kember, Jamieson, Pomfret, & Wong, 1995; Stinebrickner & Stinebrickner, 2004). The novelty of the present study also lies in the fact that the same instructor (the author of this paper) was responsible for teaching all online courses within which data were collected. This added to internal validity of the study by enhancing consistency of instrument (Collins, Onwuegbuzie, & Daros-Voseles, 2004; Thatcher, Fridjhon, & Cockcroft, 2007). Further, these courses followed similar instructional design, the main objective of which was to minimize the influence of student study skills, factors known from the literature to affect achievement (Diseth, Pallesen, Brunborg, & Larsen, 2010; Michaels & Miethe, 1989; Plant, Ericsson, Hill, & Asberg, 2005; Yukselturk & Bulut, 2007).
Knowing that the available data sources would not allow controlling for study skills, the instructor decided to design his courses so as to maximize utility of time spent online. While the courses did evolve somewhat over five semesters, the common features included readings and tests available online only, and active participation as a part of the final grade, that is, for contributing to discussions and asking or answering questions. In all online courses evaluated in the present study, students' active participation in discussions accounted for 20-30% of the final grade. Tests and quizzes were multiple choice and had to be completed online. They accounted for 40-50% of the final grade. The rest of the final grade (30-40%) was made up of written assignments, which were also completed online. When submitting their assignments, students were asked to type directly into the assignment window. This measure was primarily devised: (1) to prevent plagiarism, as the SafeAssign tool was utilized by the instructor; (2) to avoid computer viruses that reside in Microsoft Word or other text editors; and (3) to facilitate peer assessment. Students were also required to use a self and peer assessment tool. Through the use of this tool, they assessed the quality of their peers' assignments using criteria provided by their instructor.
The records of student online activity confirmed that the time spent on readings accounted for approximately half of all time students spent in online courses. It is important to emphasize that, whereas textbooks were not assigned, the assigned readings were assembled and encrypted by the instructor in a way that prevented students from printing them out. This is to say that the only way for students to complete their assigned readings was to do them online. The rationale for this strategy was twofold: to monitor whether students do the readings on time and to limit access to printing. Concerning the latter objective, it should be noted that, in an effort to conserve resources, both financial and environmental, the University had restricted excessive printing and introduced printing quotas for students.
The paper is organized as follows: The next section consists of a review of existing literature on the topic. Also included in the literature review are the research hypothesis and the description of the control variables known to influence academic outcomes. The third section contains a description of the data sample, variables, and the multinomial logit model. The fourth section presents the descriptive and multivariate empirical results. Following the presentation of the results, the paper moves on to the interpretation of the findings and avenues for future research in the fifth section, in which the limitations of the study are also discussed. The sixth section concludes the paper.
Literature Survey
The vast majority of research investigating the effect of time and effort spent by students on their achievement has been done on traditional (offline) modes of study. Collectively, prior studies that have examined the relationship between study time and achievement in offline learning environments have yielded contradictory results. In their comprehensive review of the literature on study time and academic performance, Plant et al. (2005) cited findings from numerous studies documenting a weak or unreliable relationship between the amount of self-reported study time and grades. One of the reasons for the apparent inconsistency of these findings is the fact that all prior research based on the data collected in offline classes has relied on self-reported rather than actual study time. For example, two studies – one by Schumann et al. (1985) and the other by Rau and Durand (2000) – differed in their estimation of the strength of the relationship between study time and student academic outcomes. Rau and Durand found a stronger association between study time and grades than Schumann et al. did, and attributed their relative success to superior survey methodology. In both studies, however, the data about time students spent studying came exclusively from the survey questionnaire. Even those studies that have relied on student time diaries as the major data source (e.g., Darren et al., 2008; Kember et al., 1995; Zuriff, 2003) have still been subject to the same recollection and acquiescence biases. On the one hand, students may simply underreport hours devoted to study. On the other hand, students who do not study typically feel guilty about their indolence and tend to exaggerate time (Beer & Beer, 1992; DesJardins, McCall, Ott, & Kim, 2010; Stinebrickner & Stinebrickner, 2004). Since in-class participation was and still is not considered to be a part of student effort in traditional (offline) learning environments, the focus of prior research quite naturally has been on curricular activities outside of the traditional classroom, such as doing homework. The nature of online learning is quite different in this respect. In-class and out-of-class participation cannot be easily disentangled in e-learning environments, and, in fact, the reason-d'être of online teaching is to encourage student participation (Bento & Schuster, 2003). Hence, methodologies addressing the issue of quantifying student effort in online and offline classes differ.
The advent of online learning precipitated the growth of the literature relating to the impact of student engagement (time and effort invested, frequency and level of participation) in online learning on performance (marks/grades attained, learning outcomes achieved). In an attempt to systematically analyze this literature, Hrastinski (2008) observed a variety of methodological approaches in the way researchers captured the impact of student engagement. The most common measure of online learner participation observed was the quantity of messages posted by students using tools within the learning management system (LMS, e.g., Blackboard) such as "chat lines" or conventional discussion board messages. "Since the emphasis of research has been on the use of discussion boards, the research approaches reported here are biased toward such communication," states Hrastinski (p. 1758).
An alternative methodological approach to conceptualizing the effectiveness of student participation in online courses is to look at the number of system logins (a.k.a. "hits") by students. The "system login" approach is a crude measure of online participation because one system login may last from one minute to one hour or more (if the automatic logout is not activated after some period of time). However, the main advantage of this method is that it allows the measurement of student online participation as a whole, without giving more weight to some aspects of participation (e.g., the use of discussion board) while devaluing other online activities (doing assigned readings, taking tests, writing assignments, etc.). The "system login" approach was chosen, for example, by Davies and Graff (2005), who, in a sample of 122 undergraduate business students, sought to estimate the strength of the relationships between the number of Blackboard "hits" and student grades. The limitation of this study was that Blackboard "hits" were operationalized through the use of communication and group areas only, and thus, other Blackboard activity was not accounted for. The authors found that for students achieving passing grades, the number of logins did not improve their grades, but failing students had significantly lower numbers of "hits" than students with passing grades. They concluded that "encouraging students to get more involved in online discussions is unlikely to automatically improve their performance" (p. 662).
A related approach involves measuring the amount of time students spend logged in to the e-learning environment. This approach was recently adopted by Rodgers (2008), who, in a hybrid course (i.e., one involving a mixture of face-to-face and online delivery), used OLS regression to estimate the effect of online participation (measured in terms of the hours logged into WebCT), gender, age, ethnic origin, major, academic ability (measured in terms of tariff points), and completion (not dropping out) status on the average grade (ranging from 0 to 100%). The effect of time spent online was significant and positive, such that "one extra hour of e-learning participation is found to increase the module mark by approximately one percent" (Rodgers, 2008, p. 143). A study by Coldwell, Craig, Paterson, and Mustard (2008) reported similar results: time spent online matters for achieving a better grade, while controlling for gender, age, and ethnic origin. This approach is an improvement over self-reported data because, as stated above, students tend to miscalculate the time they have spent studying. When compared to the methodology of measuring student participation through the number of login "hits," tracking time students spend online captures more variation in the data because login "hits" can vary significantly in duration. Despite its clear advantages, using time spent online as a measure of online participation is not common among studies assessing effectiveness of online learning. Interestingly, the aforementioned review of literature on online participation by Hrastinski (2008) mentions that out of 36 studies reviewed, only three used this method, and all three of those studies used self-reported data. It should be noted here that Rodgers' and Coldwell et al.'s studies were not included in Hrastinski's review.
This study builds on the body of knowledge on online participation in several distinct ways. First, it adopts the methodology of using student login times as employed by Rodgers (2008) and Coldwell et al. (2008). As said above, this methodology is a more refined measure of online student participation than using ordinal-level measures such as the number of messages posted on discussion boards or the number of logins. Additionally, as stated above, the method employed in the present study was a multinomial logistic regression rather than an OLS estimation as used by Rodgers, or the Wilcoxon z-test as used by Coldwell et al. Multinomial regression is specifically suited to the modeling of variables like grade point average (GPA). An OLS estimation does not allow for the estimation of the additional effort required for a student to move from one letter grade to another, but multinomial regression does. In this lies another point of divergence of this study from prior research, which has been almost entirely based on OLS regression. The only exception is a study by Park and Kerr (1990), who pioneered the method of multinomial logistic regression in the study of college student performance. Their method had not been tried again since then. The present study used Park and Kerr's method to test the hypothesis that students' letter grades are affected by the time they spend logged in on Blackboard. Given the paucity of works that use multinomial logistic regression in predicting achievement, it was difficult to predict whether students spend more or less time while moving from one letter grade to another. Consequently, no predictions were made concerning the direction of the differences in study time required to gain a better grade.
In addition to ability and effort, this study also controls for a number of student characteristics known from the literature as determinants of academic performance (Beer & Beer, 1992; Cappella, Wagner, & Kusmierz, 1982; Kember et al., 1995; Rau & Durand, 2000). The two learner characteristics that have often been the focus of research in e-learning are gender and age. Concerning the former, Barrett and Lally (1999), using content analysis of student online communication, found evidence for male superiority in terms on the number and length of posted messages. The results of their study also showed that, compared with males, female students were more likely to include implicit or explicit references to previous contributions. Other authors (e.g., Dille & Mezack, 1991; Lim, 2001) did not find any significant differences in the way male and female students approached e-learning tasks. Concerning the influence of age on online participation, Dille and Mezack found a positive relationship between age and several measures of achievement in online courses. Race/ethnicity of students is often mentioned as an important predictor of success in online courses (Coldwell et al., 2008; Dille & Mezack, 1991). With this said, however, it should be noted that due to ethnic homogeneity of students in the courses analyzed in the present study, ethnicity was excluded from the analyses as irrelevant. It should also be noted that all of the aforementioned factors have been found to be relevant to academic success in traditional learning environments (Michaels & Miethe, 1989; Park & Kerr, 1990; Plant et al., 2005; Ruban & McCoach, 2005; Schumann et al., 1985). Additionally, major and year in school are important in controlling for prior knowledge and skills (Coldwell et al., 2008; Rodgers, 2008). Differences in these two explanatory factors are likely to be reflected in students' future academic performance, but not in their previous academic performance. Students who major in sociology are likely to be better motivated, whereas those who have made reasonable progress toward their degree are likely to be more knowledgeable (Darren et al., 2008; DesJardins et al., 2010; Rau & Durand, 1991).
Methods
Data
The sample included all students who were enrolled in the online sociology courses at a large public university in the southwestern United States. All students who registered and completed these courses were eligible for selection, regardless of their majors or other criteria. Those students who voluntarily dropped the course before the official deadline were removed from the sample. This resulted in a reduction of 9.1%. The final sample consisted of 286 students. The sample was collected over five consecutive semesters, from Spring 2009 to Summer 2010. The courses evaluated in this study were fully online courses, meaning that the students did not meet face-to-face with the instructor, and they completed all of their coursework online. The sample included students from various majors, which, apart from sociology, comprised psychology, criminal justice, public administration, philosophy, history, education, and arts.
The University uses Blackboard as its institutional LMS. The usefulness of Blackboard cannot be overstated: first, it allows tracking student activity per class; second, only the instructor and course designer (with the permission of the instructor) have access to online records. In the present study, Blackboard was used to measure the total amount of time an individual student in a course spent online. The institution's student records that provided demographic characteristics and academic performance of each student prior to taking these courses were also used. The two sources were merged into a single file. In order to ensure anonymity and in compliance with institutional review board (IRB) procedures, students' names and institutional ID numbers were deleted.
Variables
The dependent variable in this study is educational achievement – it was intended to measure how much students learned over the period of one academic semester. The variable was measured by the letter grade (A, B, C, D, or F), that is, at an ordinal level. This circumstance alone justified the use of multinomial logistic regression. The actual time the student spent online working on course content is the key independent variable. It was measured in hours per week. Averaging time per week is carried out in order to compare time being logged in to Blackboard across regular Spring and Fall semesters as well as shorter Summer semesters. The independent variables monitoring for previous knowledge included achievement (measured as GPA) and number of credit hours taken prior to enrolling in the course. Other individual-level variables were examined in an attempt to control for demographic factors that might impact academic achievement. These included gender (where female is the reference category) and major (sociology versus other majors, the former being the reference category). Several independent variables known from the literature to impact academic outcomes (e.g., ethnicity, age, and class size) were considered at the exploratory stage but not included in the main analyses. Given the fact that exploratory analyses revealed none of the aforementioned measures as having a significant effect on the dependent variables, they were dropped from the analyses.
Analytic Strategy
The technique of multinomial logistic regression was employed to examine how the odds of receiving a specific grade versus another vary depending on time online and other variables. The independent variables (time online, prior GPA, credit hours, etc.) were regressed on the odds of receiving a specific grade versus another in turn, yielding a model for each outcome. This implies that four models were estimated, each being identified as the natural logarithm of the odds of receiving a specific grade versus another. The regression model in its general form can specified as a linear function of the explanatory variables:
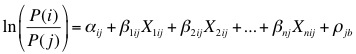 |
(1), |
where
.jpg) is the probability of getting a given grade
is the probability of getting a given grade  ;
;
.jpg) is the probability of getting a grade
is the probability of getting a grade  which serves as the reference;
 is a constant;
j.jpg) are regression coefficients of factors
are regression coefficients of factors ij.jpg) ; and
; and
 is the error term exhibiting a logistic distribution.
In order to calculate the probabilities for each grade , the following formula representing the solution of the aforementioned equation was employed:
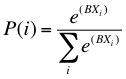 |
(2), |
where
is the probability of getting a given grade ;
 is the vector of independent variables; and
 is the vector of regression coefficients.
The regression coefficients were obtained via maximum likelihood estimation owing to the fact that the OLS estimation was not suited to the estimation of the logistic distribution.
Three sets of analyses are presented below. In the first set (Table 2), the odds of a student attaining grades A, C, D, and B versus grade F (the failing grade) are displayed. This is to show the cumulative effect of the explanatory variables. In the second set (Table 3), the most frequently assigned grade (B) was chosen as a base category against which the odds of getting the other grades (A, C, D, or F) are compared. The third set of analyses (Table 4) sought to determine the odds of getting a grade one level higher than the base category – for example, A versus B, B versus C, and so on. This was done in an attempt to reflect the amount of extra time a student needed to invest to move up to the next best grade.
Results
Descriptive Results
Table 1(a) reveals that, with respect to major, approximately equal numbers of students declared sociology and other majors at the beginning of the study period. The descriptive statistics also show that the sample's sex ratio was not balanced, with female students being an apparent majority. An average student, prior to taking the online class, had a GPA of 2.78 with a standard deviation of 0.87. Prior to being enrolled in the online sociology course, an average student had accumulated 22.5 credit hours. As evidenced by Table 1(a), on average, students spent approximately 4.7 hours per week online.
Table 1(b) shows the percentage distribution of students by the final grade received in the course and across time spent online. Generally, almost 38% of students finished with the grade B. The auxiliary descriptive results confirmed that B was not only the mean grade earned per course, but also the median and the mode in the sample. The second most frequently assigned final grade was A. Approximately 31% of students received this grade in the online classes. Grades C and D were much less common, with approximately 14% and 13% of students, respectively, attaining those grades. Finally, the failing grade was given to 4.5% of students. The average amount of time spent logged in to Blackboard across the grade received in an online sociology class demonstrated that students who earned the highest grades (A) spent the most amount of time online. In contrast, the students who received an F spent the least time online (approximately 2.1 hours, or 2.6 times less than students who earned an A). Broadly speaking, Table 1(b) suggests that a positive relationship between time online and grade is likely.
Table 1. Descriptive statistics of the study sample
(a) Independent variables
Variables |
Percentage |
|
|
|
Major |
|
|
|
|
Sociology |
47.6 |
|
|
|
Other major |
52.4 |
|
|
|
Gender |
|
|
|
|
Male |
37.8 |
|
|
|
Female |
62.2 |
|
|
|
|
Mean |
SD |
Min. |
Max. |
Prior GPA |
2.78 |
0.87 |
0.0 |
4.0 |
Accumulated credit hours |
22.5 |
14.0 |
0.0 |
46.4 |
Time spent online |
4.7 |
2.1 |
0.8 |
12.5 |
(b) Dependent variable vs. time online
Dependent Variable |
Percentage |
Average Time Online |
Grade A |
30.8 |
5.4 |
Grade B |
37.8 |
4.9 |
Grade C |
14.3 |
4.3 |
Grade D |
12.6 |
3.8 |
Grade F |
4.5 |
2.1 |
Multivariate Results
Table 2 shows the odds of getting grades A, B, C, and D versus F. The prior achievement (measured as GPA) at the beginning of the course was the most significant predictor of the odds for all grades in this and subsequent tables (see Tables 3 and 4). The effects of prior achievement were in predicted direction and were robust: they were significant at the p < .05 level, at least, with the majority being significant at p < .001. This finding is compatible with past research indicating that prior achievement is a solid predictor of current and future performance (Darren et al., 2008; Lahmers & Zulauf, 2000; Park & Kerr, 1990; Plant et al., 2005; Rau & Durand, 2000; Schuman et al., 1985). The major finding, however, was that the coefficients for time online were significant at the p < .01 level. Observe that the effect of time online grew steadily from the lower (C and D) to the higher (A and B) grades, which was in agreement with the expected returns for effort. For example, an hour per week increase in time spent online resulted in the odds of getting a D increasing by 0.529 and the odds of getting an A increasing by 1.232.
Table 2. Multinomial logistic regression coefficients and significance levels of their standard errors (in parentheses); base category: grade F
|
Ln (PA/PF) |
Ln (PB/PF) |
Ln (PC/PF) |
Ln (PD/PF) |
Constant |
-4.271 |
*** |
(0.132) |
-3.813 |
*** |
(0.211) |
-1.881 |
*** |
(0.138) |
-1.676 |
*** |
(0.144) |
Time |
1.232 |
*** |
(0.303) |
1.101 |
*** |
(0.232) |
0.606 |
** |
(0.188) |
0.529 |
** |
(0.193) |
GPA |
1.946 |
*** |
(0.237) |
1.294 |
*** |
(0.314) |
0.807 |
*** |
(0.253) |
0.775 |
*** |
(0.251) |
Credit |
0.327 |
* |
(0.135) |
0.315 |
* |
(0.110) |
0.250 |
|
(0.068) |
0.122 |
|
(0.053) |
Major |
1.204 |
** |
(0.292) |
0.912 |
* |
(0.278) |
0.387 |
* |
(0.133) |
0.363 |
* |
(0.109) |
Male |
-0.885 |
* |
(0.236) |
-0.484 |
|
(0.207) |
-0.213 |
|
(0.122) |
0.035 |
|
(0.073) |
-2 Log likelihood |
1,482 |
|
|
|
|
|
|
|
|
|
Pseudo R2 |
0.279 |
|
|
|
|
|
|
|
|
|
* p < .05. ** p < .01. *** p < .001.
Additionally, as evidenced in Table 2, the students' choice of major had a significant effect (p < .05) on the log odds of A, B, C, and D against F. This implies that students majoring in sociology were advantaged academically as compared to students who chose other majors. The other effects in Table 2 were inconsistently significant. The effect of the accumulated credit hours was significant only when predicting the odds of higher grades (A and B) and was not significant when predicting the odds of the lower grades (C and D), whereas the effect of being male was only significant for the odds of A against F. Although the gender effect seemed to be the least important predictor of the probability of receiving a non-failing grade, the fact that female students outperformed male students is noteworthy because the evidence about the gender effect on performance in sociology classes has been contradictory so far (Michaels & Miethe, 1989; Rau & Durand, 2000; Ruban & McCoach, 2005).
Table 3 repeats the analyses presented in Table 2, except that the base category was the grade B. Observe the reversal of signs of the explanatory variables' regression coefficients for the odds of C, D, and F. This is expected, since the letter grade B was the reference category, and thus the odds of getting a lower grade than B should be negatively associated with time online and the other explanatory variables. As it was in Table 2, the effect of prior achievement was robust, which is suggestive of the strong and positive relationship between the current and past academic achievement. The effect of time was significant (p < .05) for the odds of C, D, and F over B, but not for the odds of A over B. This indicates that the probability of receiving an A over a B cannot be improved through additional input of effort. None of the other effects were significant, with the exception of those of credit hours and major, which were marginally significant (p < .05) in the case of D versus F. This suggests that, apart from the aforementioned effects of time online and prior achievement, the odds of getting a non-failing grade versus B, the most frequently assigned grade, do not depend on the accumulated credit hours, major, and gender.
The odds of getting one grade versus the next best grade are shown in Table 4. Again, as seen in previous models, prior GPA had a significant and positive effect on the odds of getting a better grade. On the question of time spent online, it should be noted that the pattern of change in the amount of time necessary to produce a one-point increase in a student's grade was not consistent. For example, the letter grade F was an outlier: a relatively small increase in hours spent online might substantially reduce the odds of failing a course (p < .01). Comparable by magnitude, but not by significance (p < .05), was the amount of time online necessary to move from C to B. It appears that the grades A and B, on the one hand, and C and D on the other, were clustered together. This means that the odds of getting an A versus B and the odds of getting a C versus D cannot be improved substantially by time spent online. The impact of all other variables on the probabilities of improving a grade by one point was negligible. Only major (sociology versus other majors) had a positive effect on moving from F to D (p < .01).
Table 3. Multinomial logistic regression coefficients and significance levels of their standard errors (in parentheses); base category: grade B
|
Ln (PA/PB) |
Ln (PC/PB) |
Ln (PD/PB) |
Ln (PF/PB) |
Constant |
-1.110 |
*** |
(0.112) |
1.726 |
*** |
(0.145) |
2.528 |
*** |
(0.173) |
3.813 |
*** |
(0.211) |
Time |
0.049 |
|
(0.147) |
-0.434 |
* |
(0.161) |
-0.593 |
*** |
(0.180) |
-1.101 |
*** |
(0.232) |
GPA |
0.846 |
*** |
(0.213) |
-0.994 |
*** |
(0.237) |
-1.423 |
*** |
(0.251) |
-1.293 |
*** |
(0.314) |
Credit |
0.074 |
|
(0.089) |
-0.082 |
|
(0.105) |
-0.123 |
|
(0.148) |
-0.315 |
* |
(0.110) |
Major |
0.104 |
|
(0.171) |
-0.398 |
|
(0.225) |
-0.404 |
|
(0.253) |
-0.912 |
* |
(0.278) |
Male |
-0.076 |
|
(0.109) |
0.168 |
|
(0.153) |
0.262 |
|
(0.195) |
0.484 |
|
(0.207) |
-2 Log likelihood |
1,482 |
|
|
|
|
|
|
|
|
|
Pseudo R2 |
0.279 |
|
|
|
|
|
|
|
|
|
* p < .05. ** p < .01. *** p < .001.
Table 4. Multinomial logistic regression coefficients and significance levels of their standard errors (in parentheses); shifting base categories
|
Ln (PA/PB) |
Ln (PB/PC) |
Ln (PC/PD) |
Ln (PD/PF) |
Constant |
-1.110 |
*** |
(0.112) |
-1.726 |
*** |
(0.145) |
-1.83 |
*** |
-0.139 |
-1.676 |
*** |
(0.144) |
Time |
0.049 |
|
(0.147) |
0.434 |
* |
(0.161) |
0.218 |
|
(0.175) |
0.529 |
** |
(0.193) |
GPA |
0.846 |
*** |
(0.213) |
0.994 |
*** |
(0.237) |
0.674 |
* |
(0.229) |
0.775 |
*** |
(0.251) |
Credit |
0.074 |
|
(0.089) |
-0.082 |
|
(0.105) |
0.111 |
|
(0.094) |
0.122 |
|
(0.053) |
Major |
0.104 |
|
(0.171) |
0.398 |
|
(0.226) |
0.104 |
|
(0.136) |
0.363 |
* |
(0.109) |
Male |
-0.076 |
|
(0.109) |
-0.168 |
|
(0.153) |
-0.076 |
|
(0.081) |
0.035 |
|
(0.073) |
-2 Log likelihood |
1,482 |
|
|
|
|
|
|
|
|
|
Pseudo R2 |
0.279 |
|
|
|
|
|
|
|
|
|
* p < .05. ** p < .01. *** p < .001.
Discussion
The analytic strategy employed in this study was to regress time online, prior achievement, major, credit hours, and gender on the odds of receiving a particular academic grade over another. This strategy is an improvement over an OLS regression because it is better suited to estimation involving ordinal variables, such as grades. The other major strengths of this study include reliance on duration of time online rather than number of system logins, as well as consistency of measurement arising from the fact that the same instructor taught all of the courses involved and all curricular activities were available online.
On the question of whether or not time online matters for achieving a better academic grade, this study gives a positive answer. The study found a positive and significant relationship between the time students spent logged to Blackboard and the grade they achieved in the course. However, the results also point to the limits of what students can achieve by allocating extra time for studying. According to the multivariate results, time online matters for improving the failing grade more than any other grade. Furthermore, extra time online matters for moving from the lower grades (C and D) to the higher grades (A and B). These results were obtained after controlling for gender and previous knowledge proxied by the student's GPA, major, and credit hours (measured prior to taking the course).
This study has produced some interesting findings that, if replicable and generalizable, have important implications for different parties involved in the educational process. Quantifying the influence of time spent online on grades is important from the perspective of the university administrator, who is in charge of teaching policies; from the perspective of the instructor, who is responsible for student learning outcomes; and from the perspective of the student, who seeks to balance time and effort. From the administrator's point of view, keeping track of students' online activities is of as much importance as keeping instructors accountable for credit hours assigned to them. For administrators, the growing emphasis on accountability and assessment will inevitably require attention to find quantifiable indicators of student achievement and outcomes. Consequently, administrators are putting pressure on instructors to match the desired learning outcomes with measures of student effort. From the instructor's perspective, the current results suggest that activities encouraging students to spend more time online will lead to higher levels of achievement. Finally, students, who now pay a larger proportion of direct costs for their education and want to hold universities and colleges accountable for services they purchase, demand to know much effort is necessary to earn a desired grade. For them, these findings imply that success will come when time and effort are put in from day one of classes.
However, the present study has some limitations that can be addressed only through further research. The most important of these is the inability, given the scope of the data, to account for study skills/habits, known from earlier research to be important predictors of academic performance (Cappella et al., 1982; Plant et al., 2005; Ruban & McCoach, 2005). Another limitation is the small sample size, which raises concern about the ability to generalize the results. It is worth noting that student participants in this study were similar to their fellow students in other courses offered by the sociology department at the University with regard to age, ethnicity, and gender. Yet another limitation of the present study is that the total amount of time spent on a course was used as the measure of student effort. Due to the ability of students to perform multitasking with multiple browser windows, this measure – while significant in the analysis – lacks precision. Disaggregating course time can make a difference. It is possible that the amount of time spent in each tool within the LMS (e.g., reading rooms and discussion sections), the number of discussion comments read versus posted, and the completion or otherwise of sample tests and quizzes may have an impact on performance.
Future research that combines an extensive survey of study skills with electronically collected data on time spent by students in different online learning activities will enable the ascertainment of the relative importance of time online and time management strategies. Moreover, it might be interesting for future research to explore qualitative measures of participation in online courses such as peer-reviewed quality of writing and reading. It is acknowledged that additional studies across a wide variety of courses in a range of higher education institutions would yield a better, more robust understanding of the relationship between time online and other measures of participation and academic performance than that which was yielded by the present study.
Conclusion
In sum, the multivariate analyses carried out as part of the study reported in this paper demonstrated that previous record of achievement translated into increased odds of receiving a higher grade in all scenarios examined. Apart from this factor, which was, by far, the most important predictor of getting a better grade, the student's participation as measured by the amount of time he/she spent online had a significant impact on his/her movement from F to C and D, and from C and D to A and B. This finding lends support to the hypothesis that that the odds of attaining a particular academic grade are at least partially explained by the time spent studying. The effects of other independent variables (major, credit hours, and gender) were inconsistent. Major and credit hours had a significant impact on the odds of students achieving the higher grades (A and B) versus F, but not the lower grades (C and D). Only the odds of moving from the failing grade (F) to the top grade (A) were influenced, at the conventional significance levels, by gender.
There is also a practical implication that should be mentioned here. The estimated regression models can be used to make predictions. The estimated model can predict the odds of a certain grade over another of a student with particular characteristics, depending on the effort invested by the student as proxied by time spent online. For example, what are the odds of an average student receiving a B over a C? Suppose a female student has a cumulative GPA of 2.78, does not major in sociology, and has accumulated 22.5 credit hours. Plugging these data into equation (1) and solving it with respect to time online produces a result of 0.32 hours, or approximately 19 minutes, per week. This implies that, all things equal, an average student has to study online for an additional 19 minutes per week in order to move from grade C to B.
References
Allen, I. E., & Seaman, J. (2010). Learning on demand: Online education in the United States, 2009. Babson Park, MA: Babson Survey Research Group. Retrieved from http://www.sloanconsortium.org/publications/survey/pdf/learningondemand.pdf
Barrett, E., & Lally, V. (1999). Gender differences in an on-line learning environment. Journal of Computer Assisted Learning, 15(1), 48-60. doi:10.1046/j.1365-2729.1999.151075.x
Beer, J., & Beer, J. (1992). Classroom and home study times and grades while at college using a single-subject design. Psychological Reports, 71(1), 233-234. doi:10.2466/pr0.1992.71.1.233
Bento, R., & Schuster, C. (2003). Participation: The online challenge. In A. K. Aggarwal (Ed.), Web-based education: Learning from experience (pp. 156-164). Hershey, PA: IRM Press. doi:10.4018/978-1-59140-102-5.ch010
Cappella, B. J., Wagner, M., & Kusmierz, J. A. (1982). Relation of study habits and attitudes to academic performance. Psychological Reports, 50(2), 593-594. doi:10.2466/pr0.1982.50.2.593
Coldwell, J., Craig, A., Paterson, T., & Mustard, J. (2008). Online students: Relationships between participation, demographics and academic performance. Electronic Journal of e-Learning, 6(1), 19-30. Retrieved from http://www.ejel.org/issue/download.html?idArticle=57
Collins, K. M. T., Onwuegbuzie, A. J., & Daros-Voseles, D. A. (2004). Role of anxiety on graduate cooperative groups. Academic Exchange Quarterly, 8(3), 147-151.
Davies, J., & Graff, M. (2005). Performance in e-learning: Online participation and student grades. British Journal of Educational Technology, 36(4), 657-663. doi:10.1111/j.1467-8535.2005.00542.x
Darren, G., Dixon, S., Stansal, E., Gelb, S. L., & Pheri, T. (2008). Time diary and questionnaire assessment of factors associated with academic and personal success among university undergraduates. Journal of American College Health, 56(6), 706-715. doi:10.3200/JACH.56.6.706-715
DesJardins, S. L., McCall, B. P., Ott, M., & Kim J. (2010). A quasi-experimental investigation of how the Gates Millennium Scholars Program is related to college students' time use and activities. Educational Evaluation and Policy Analysis, 32(4), 456-475. doi:10.3102/0162373710380739
Dille, B., & Mezack, M. (1991). Identifying predictors of high risk among community college telecourse students. American Journal of Distance Education, 5(1), 24-35. doi:10.1080/08923649109526729
Diseth, Å., Pallesen, S., Brunborg, G. S., & Larsen, S. (2010). Academic achievement among first semester undergraduate psychology students: The role of course experience, effort, motives and learning strategies. Higher Education, 59(3), 335-352. doi:10.1007/s10734-009-9251-8
Garrett, R. (2004). The real story behind the failure of U.K. eUniversity. EDUCAUSE Quarterly, 27(4), 3-6. Retrieved from http://www.educause.edu/ero/article/real-story-behind-failure-uk-euniversity
Garrison, D. R., & Anderson, T. (2003). E-learning in the 21st century: A framework for research and practice. London: Routledge. doi:10.4324/9780203166093
Lahmers, A. G., & Zulauf, C. R. (2000). Factors associated with academic time use and academic performance of college students: A recursive approach. Journal of College Student Development, 41(5), 544-556.
Hinrichsen, J. J. (1972). Prediction of grade point average from estimated study behaviors. Psychological Reports, 31(3), 974-975. doi:10.2466/pr0.1972.31.3.974
Hrastinski, S. (2008). What is online learner participation? A literature review. Computers & Education, 51(4), 1755-1765. doi:10.1016/j.compedu.2008.05.005
Kearsley, G. (2000). Online education: Learning and teaching in cyberspace. Belmont, CA: Wadsworth.
Kember, D., Jamieson, Q. W., Pomfret, M., & Wong, E. T. T. (1995). Learning approaches, study time and academic performance. Higher Education, 29(3), 329-343. doi:10.1007/BF01384497
Lim, C. K. (2001). Computer self-efficacy, academic self-concept, and other predictors of satisfaction and future participation of adult distance learners. American Journal of Distance Education, 15(2), 41-51. doi:10.1080/08923640109527083
Michaels, J. W., & Miethe, T. D. (1989). Academic effort and college grades. Social Forces, 68(1), 309-319. doi:10.1093/sf/68.1.309
Oliver, R. (2005). Quality assurance and e-learning: Blue skies and pragmatism. ALT-J, Research in Learning Technology, 13(3), 173-187. doi:10.1080/09687760500376389
Park, K. H., & Kerr, P. M. (1990). Determinants of academic performance: A multinomial logit approach. Journal of Economic Education, 21(2), 101-111. doi:10.2307/1181978
Plant, E. A., Ericsson, K. A., Hill, L., & Asberg, K. (2005). Why study time does not predict grade point average across college students: Implications of deliberate practice for academic performance. Contemporary Educational Psychology, 30(1), 96-116. doi:10.1016/j.cedpsych.2004.06.001
Rau, W., & Durand, A. (2000). The academic ethic and college grades: Does hard work help students to "make the grade"? Sociology of Education, 73(1), 19-38. doi:10.2307/2673197
Rodgers, T. (2008). Student engagement in the e-learning process and the impact on their grades. International Journal of Cyber Society and Education, 1(2), 143-156. Retrieved from http://www.academic-journals.org/ojs2/index.php/IJCSE/article/download/519/13
Ruban, L. M., & McCoach, D. B. (2005). Gender differences in explaining grades using structural equation modeling. The Review of Higher Education, 28(4), 475-502. doi:10.1353/rhe.2005.0049
Stinebrickner, R., & Stinebrickner, T. R. (2004). Time-use and college outcomes. Journal of Econometrics, 121(1-2), 243-269. doi:10.1016/j.jeconom.2003.10.013
Schuman, H., Walsh, E., Olson, C., & Etheridge, B. (1985). Effort and reward: The assumption that college grades are affected by quantity of study. Social Forces, 63(4), 945-966. doi:10.1093/sf/63.4.945
Thatcher, A., Fridjhon, P., & Cockcroft, K. (2007). The relationship between lecture attendance and academic performance in an undergraduate psychology class. South African Journal of Psychology, 37(3), 656-660.
Yukselturk, E., & Bulut, S. (2007). Predictors for student success in an online course. Educational Technology & Society, 10(2), 71-83. Retrieved from http://www.ifets.info/journals/10_2/7.pdf
Zuriff, G. E. (2003). A method for measuring student study time and preliminary results. College Student Journal, 37(1), 72-78.