MERLOT Journal of Online Learning and Teaching
Vol. 4, No. 3, September 2008

Student Preferences, Satisfaction, and Perceived Learning in an Online Mathematics Class


Julie Glass
Department of Mathematics and Computer Science
California State University, East Bay
Hayward, CA  94542 USA
Julie.Glass@csueastbay.edu


Valerie Sue
Department of Communication
California State University, East Bay
Hayward, CA  94542 USA
Valerie.Sue@csueastbay.edu


Abstract

This study analyzes student preference, satisfaction and perceived learning in an online college mathematics course for business majors.  Using a combination of active and passive learning objects, the online course was developed to investigate the instructional strategies students use the most, prefer and believe impact their learning.  Students answered weekly surveys about the course.  They were asked to report their usage of the learning objects and to reflect on their interactions with the material and with each other.  They were also asked to assess the impact that various learning objects had on their learning and on their satisfaction with the course and with the material.  Of the learning objects investigated, homework emerged as the factor students preferred and used the most, and that they felt had the greatest impact on their learning.  Participation in online discussions did not surface as a favored or significant factor in the students’ learning.  This work is aimed at informing best practices for increasing student engagement, and thus learning, in online mathematics and other similar courses. 

Keywords: Online learning, Learning Objects, Active Learning, Mathematics, Survey Research


Introduction

The Internet has brought about a paradigm shift in the way professors teach and students learn.  Online courses, an experimental concept less than a decade ago, have become de rigueur for postsecondary institutions wishing to maintain a presence at the forefront of educational innovation.  Research about online teaching and learning has, however, struggled to keep pace with the rapid development of the field.  Recently, the focus has shifted from questions surrounding whether online education is effective to how best to achieve important student learning outcomes in online environments.   This study analyzes student preference, satisfaction and perceived learning in an online mathematics course.  Students answered weekly surveys about the course.  They were asked to reflect on their interactions with the material, each other and the professor as well as on the impact that various learning objects had on their learning and on their engagement in the course.  This work is aimed at informing best practices for organizing and presenting course material in online mathematics and related courses. 

Literature Survey


The Internet has provided a new mechanism for connecting teachers and students; however, distance education is hardly a new concept. Saba (2005) notes that distance learning can be traced back to the 1800s; technological developments, including radio in the 1920s, television in the 1950s, and the use of the Internet by civilian organizations in the mid-1980s, have contributed to moving distance education from a fringe activity to a central focus in American higher education. Whether the method is termed distance education, distributed learning, e-learning or online education, one consistent goal in the study of these methods of bringing instructors and learners together has been to determine optimal strategies for enhancing the student learning experience.

One avenue of research activity that has received attention across disciplinary boundaries is focused on the notion of active learning. Active learning is fostered when instructional methods engage students in the learning process (Bonwell & Eison, 1991). Active learning takes place when instructors ask students to reflect on what students are doing and participate in meaningful learning activities. In an online learning context, this may take the form of journal entries or discussion board postings as well as traditional homework assignments or simulation exercises. In an extensive review of the literature surrounding active learning, Prince (2004) discovered substantial empirical support for the assertion that active learning can significantly improve recall of information and substantially contributes to student engagement. Active learning strategies have been shown to lead not only to greater retention of course material but also to increased satisfaction in online courses (Sahin, 2007).

The literature regarding student satisfaction in online courses is less clear cut than the active learning line of studies. While some researchers have found that learner-centered activities are central to student satisfaction in online courses (Ellis & Cohen, 2005), Cuthrell and Lyon’s (2007) recent investigation discovered that students preferred a mix of instructional strategies that incorporated active and passive modes of instruction. Other factors that have been shown to be related to student satisfaction in online courses are presence (social, cognitive and teaching) (Pelz, 2004), community (Sahin, 2007) and frequent feedback and assessment (Swan, 2003).

In a study of non-posting (i.e., lurking) discussion board behavior among students in online classes, Dennen (2008) found that about half of the students felt that they learned through online discussions (both posting and reading messages); students who reported that they participated in discussion only to meet course requirements and those who focused more on posting rather than reading messages had less positive impressions of the discussions’ impact on their learning.

The nomenclature of learning objects (LOs) provides a useful framework for discussing the Web-based multimedia systems used to deliver instructional content in online courses. Learning objects have engendered considerable debate as of late (Bennett & McGee, 2005; Friesen, 2003; Parrish, 2004) and definitions vary widely (Liber, 2005), however, the fervor with which supporters and detractors continue to engage in debate over both the explication of the concept and its utility for higher education is an indication of the resilience of the concept.

As defined by Hodgins (2000), LOs are small, reusable instructional components designed to achieve specific learning objectives that are delivered via the Internet. Hodgins (2000) compared LOs to LEGO building blocks; that is, individual course components that can be easily added, removed or replaced, making course content highly adaptable. Wiley (2002) broadened the concept by defining LOs as any digital resource that can be reused to support learning. The definition of LOs used in the present research follows loosely from Hodgins’ (2000) original definition.

With the literature concerning student preferences, satisfaction and perceived learning as a base (with particular attention being given to active learning strategies), and with the taxonomy of learning objects as a framework, this research endeavored to investigate the LOs that students preferred, used the most and were the most satisfied with as well as the LOs that they believed had the most impact on their learning.


The course and the university

The vehicle for this study was a quarter-long (ten weeks) online mathematics course for Business and Social Science students at California State University, East Bay (CSUEB).  CSUEB is a mid-sized comprehensive, public urban university in the San Francisco Bay Area.  The student population is highly varied in age, ethnicity and socioeconomic status (see participants section).  The course has a prerequisite of college algebra and is required for all business majors and for entry into the MBA program. The course consisted of ten learning modules consisting of two lectures and a series of online assignments.  Students were required to complete one module each week for which all material was made available at midnight on  the first day of the week.  The course material included:  functions and graphs; exponential and logarithmic functions; mathematics of accounting and finance; matrices and systems of equations; linear programming (a geometric approach); and an introduction to differential and integral calculus with applications to business and social sciences.  Grades were based on a total of 1000 points as shown in Table 1 below and the grades were assigned based upon a standard points-to-grades scheme as shown in Table 2.


Table 1.  Point distribution for Learning Objects

LO

Points

Homework Discussion Quizzes Midterm
Final Exam

Total Possible

240 (12 points each)
60
200 (20 points each)

200

300

1000


Table 2. Points to Grade Scheme

Total Pts Earned

Grade Assigned

Total Pts
Earned

Grade Assigned

930 – 1000

900 – 929

870 – 899

830 – 869

800 – 829


A

A-

B+

B

B-


770 – 799

730 – 769

700 – 729

670 – 699

600 – 669

< 600

C+

C

C-

D+

D

F


The course was delivered via the Blackboard (Bb) Course Management System (CMS).  All homework, quizzes and examinations were completed on a publisher-supported course shell, Course Compass, utilizing an online homework service, My Math Lab (CC/MML).  All course requirements were completed totally online except the final exam which students were required to take in person.  The instructor was present at the final exam, however all other content was completed without a proctor present.  A detailed table of activities and deadlines was provided to students at the beginning of the quarter.  The course was structured so as to require students to work regularly on the material.  The instructor was available to answer questions online and in person via online and face-to-face office hours as well as discussion boards and via e-mail.   

Learning Objects

The primary focus for this study was usage and perceived impact on learning of the LOs as described in Table 3.  Figure 1 illustrates the connections between each of the LOs and satisfaction and learning. The course included the following required components: weekly homework, discussion, quizzes, one midterm examination and a final examination.  It should be noted that there was some overlap between the LOs (Table 3) and the required components of the course.  This is an obvious result of the fact that some LOs are needed to simply convey information while others involve active participation on the part of the student (e.g. homework, quizzes, etc.)  Moreover, in any valid course design, one would expect required components to be a mode of content delivery, i.e. an integral part of the learning experience

Table 3:  Description of Learning Objects

Learning Object

Active/Passive

Required/Optional

Description

PowerPoint


Passive

Optional

Two weekly sets of PowerPoint slides which were also embedded in the video lectures and were available for printing and review on the course Bb site.

Text


Passive

Optional

Students were able to purchase a hard copy text or view an e-text on the CC/MML course site.  Specific examples, “matched problems,” and “look in the book” exercises were referenced in the video lectures.  Note that the text is classified as passive because that is generally the manner in which students utilize the text.  The authors acknowledge that active utilization of the text is possible and desirable. 

Video Lectures


Passive

Optional

Two weekly media-enhanced lectures created using Microsoft Acustudio.  Lectures included head and shoulder video of the instructor, audio, PowerPoint slides and a white board feature (“examples by hand”).  See Figure 2.

Homework


Active

Required

Two required homework assignments each week.  All homework was done on the publisher supported site CC/MML.  While doing homework, extensive worked examples (generated by MML) and “hints” are available.  See Figure 3. 

Discussions


Active

Required & Optional

Students were required to respond weekly to instructor-provided prompts designed to encourage higher level thinking about the weekly content. Optional discussion boards were available for general and mathematical questions and comments.

Quizzes

Active

Required

Required weekly quizzes which were completed on the CC/MML site. 


Methods

The data for this project were collected via a series of online surveys.  The first survey of the quarter gathered general demographic information, data related to learning styles and information about math attitudes.  The weekly surveys, beginning in Week 2 of the course, were brief and focused on the students’ activity during the week, related to each of the LOs.  Students were asked whether they used each of the LOs and how much they felt that each one contributed to their learning of the week’s course material.  The longer, final survey of the term allowed the students to rate each LO and to evaluate the course overall. This data collection process was designed to place non-grade-related data and assessments outside the domain of the course.  The survey data were supplemented with student grades and course component utilization statistics collected from Course Compass.


Figure 1.  LO Interaction with Student Satisfaction and Perceived Impact on Learning


Figure 2. Screenshot of Lecture

Participants


Table 4 provides participant demographics for the course.  A total of 55 students consented to participate in the research.  Women were the majority of the sample, accounting for three-quarters of the participants; most were juniors or seniors and about a third were graduate students.  The wide age range (19 to 47-years-old) and somewhat high mean age of 27.8 is typical for this university, where the campus-wide mean age is 30-years-old.


Figure 3.  Screenshot of Homework Module


Table 4.  Demographic Profile of Research Participants

Characteristic

Frequency (percent)

Gender
      Male
      Female


14 (25.5%)
41 (74.5%)

Class level
      Freshman/Sophomore
      Junior
      Senior
      Graduate student


2 (3.6%)
21 (38.2%)
15 (27.3%)
17 (30.9%)

Major
      Undergraduate Business
      MBA
      Other


42 (76.4%)
10 (18.2%)
3 (5.5%)

Age
      Range
      Mean
      Median
      Mode
      Standard deviation


19 – 47
27.8
20
7.0


The students reported working an average of 31.7 hours per week at a job or internship and 82% had taken at least one other online class.  When asked why they signed up for this particular online course, “flexibility” and “to accommodate work schedules” were the two most popular reasons.

Results

Preferences.  To establish a baseline measure of preferences for various LOs, students were asked at the beginning of the quarter to report how much they liked or disliked a variety of teaching methods.  The results are presented in Table 5.  The clear preference for practice exercises and low rating of online discussions among these online students foretells the usage and satisfaction results that were subsequently discovered.


 Table 5.  Student Learning Preferences

Method


N


Mean
(1=dislike very much,
5=like very much)

SD


Practice exercises

55

4.20

.78

Video lectures

55

4.00

.97

One-on-one w/instructor (online)

55

3.71

.81

Online discussions

55

3.36

1.16


Utilization.
  Every week, the students were asked to report whether they had used each LO and then to indicate how much each LO contributed to their learning of the week’s course material.  Figure 4 provides a percent summary of utilization feedback.  Percent utilization was calculated as (# utilizing LO / total respondents) x 100.  All survey questions were optional; therefore, sample sizes for each question and across surveys varied.  For example, the smallest sample size represented by the data in Figure 4 is 47 and the largest is 55.  Week 6 was midterm week; therefore, there was no quiz.  Also during Week 6, the discussion question, rather than addressing specific course content, asked that each student reflect on the course so far, resulting in a spike in participation.

 
Figure 4.  Learning Object Utilization During the Course


It should be noted that the overlap between required components of the course such as homework, quizzes and discussion participation, and those LOs that are non-participatory and optional such as text, PowerPoint slides, and lectures, should have an impact on reported usage.  Homework emerged as the LO that students reported using most; this was remarkably consistent throughout the quarter.  The low utilization was in Week 5 when 96% of the students surveyed said that they did the homework; the highest utilization was in Week 9 when 100% of the respondents said they did the homework.  Participation in the required weekly quizzes was consistently quite high (range = 88% - 96%, overall mean = 89%).  Fewer students reported reading the text (range = 65% - 78%, overall mean = 70%) and PowerPoint slides (range = 53% - 65%, overall mean = 58%) but utilization of these LOs was fairly stable over time as well.  There was more variation in reports of watching the video lectures (range = 46% - 73%, overall mean = 56%), and participating in Blackboard discussions (range = 53% - 90%, overall mean= 68%) Course Compass afforded the opportunity to track the amount of time that students spent on homework.  Figure 5 shows the mean time spent doing homework on Course Compass throughout the course.  The first homework assignment of the course required students to simply report that they had successfully logged in to the Course Compass site (which they had to do to have access to the homework assignment) thus resulting in an average of 43 seconds spent on that homework assignment.  As the course progressed and the homework became more challenging, time spent on homework increased dramatically; homework 8 had the highest mean time of almost two-and-a-half hours.  It should be noted that this data represents the amount of time that students were logged on to the homework site; clearly, it is not possible to know whether they were actively working homework problems during the entire time that they were on the Web site.  In addition, students were encouraged to print out the homework assignments, work offline, and then log in to enter their responses.  Thus, the time spent-data from CC/MML could, in fact, be higher or lower than actual time spent working with the material. 


Course Compass also recorded how much time students spent on quizzes; since the quizzes were timed, however, the “time spent” data were deemed not relevant for this study.


  Figure 5.  Mean “Time Spent” on Homework


Contribution to Learning.
  Along with reporting whether they had used each of the LOs, students indicated how much they felt that each one had contributed to their learning of the week’s course material.  These questions were measured on a 1-to-5 point scale where 1 meant that the LO made no contribution to learning and 5 meant that the LO contributed a lot to the learning of that week’s material.  Figures 6 and 7 present the mean weekly ratings for each LO; Figure 6 shows the averages for the passive LOs:  lecture, text and PowerPoint slides; Figure 7 displays the averages for the active LOs:  homework, quizzes and discussions.  When presented this way, it is clear to see that students perceived the passive LOs to have varying contributions to their learning during the course; in week 2, for example, the PowerPoint had the greatest mean and this value then declines, spikes, and dips again near the end of the quarter.  The lecture shows the opposite pattern, and the means for all three passive LOs converge in week 6.


Figure 6. Contribution of Passive LOs to Perceived Learning


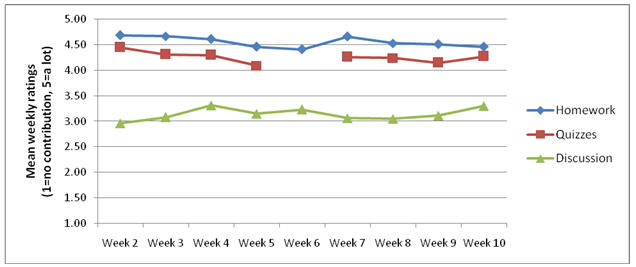
Figure 7.   Contribution of Active LOs to Perceived Learning.


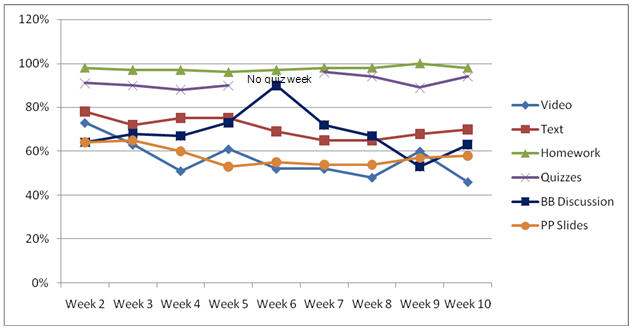
The active LOs, on the other hand, are stable throughout the 10 weeks of the course.  Homework was consistently reported to have the greatest contribution to the learning, quizzes were also said to have had an impact on learning and, according to the students, Blackboard discussions consistently contributed less to their learning of the material.  As previously noted, these active LOs also correspond to the required components of the course. 
Although the students were given opportunities throughout the quarter to rate the contribution of each LO to their learning, they were asked to do so again on the final survey.  The question on the final survey asked them to reflect globally on the contribution of each LO to their overall learning of the course material.  The mean overall ratings are in Table 6.    The students reported that the homework assignments contributed the most to their overall learning of the material.  This is consistent with responses from the weekly surveys where homework was reported to be the LO having the greatest contribution to learning every week.

Table 6.  Contribution of LOs to Overall Learning

Learning Object


N


Mean

(1=not at all, 5=a lot)

SD


Homework

45

4.71

  .66

Quizzes

45

4.31

1.02

PowerPoint slides

45

4.02

1.25

Lectures

45

3.91

1.46

Text

45

3.33

1.38

Blackboard discussions

45

3.02

1.37

To validate the rating data, students were presented with five LOs (quizzes were not included in this ranking question) and asked to rank them based on which they believed had the greatest overall impact on them; the results of those rankings are in Table 7.  In this ranking exercise, it was impossible to assign the same rank to more than one item; therefore, students who might have rated, homework and lectures, for example,  as both having a lot of impact on their learning were forced to choose which had the most impact, which had the second most impact, and so on.  As with the quality and learning contribution ratings previously presented, homework emerged as the most important LO, ranking #1.

Without this impact ranking data, one might conclude that the required LOs would always come out “on top” of the pile in terms of impact on learning; however, note that this is not the case.  Homework came out on top for usage and impact on learning, but the 2nd, 3rd, and 4th LOs (lectures, PowerPoint and text) ranked in terms of overall impact were not required LOs and did not rank high in terms of  usage (see Figure 4).  This is additional evidence of the importance and value of the homework support provided by the CC/MML site.

Table 7. Impact on learning of LOs—Overall Rankings

LO


Rank


Homework

1st

Lectures

2nd

PowerPoint slides

3rd

Text

4th

Blackboard discussions

5th


Quality
.  In the final survey of the quarter, students were asked to rate the quality of each of the LOs.  Table 8 presents the mean ratings (on a 1-to-4 point scale) of each LO.  Homework, the LO that students consistently used the most, and that they felt contributed the most to their learning, was rated highest quality; the text, which was used moderately, received the lowest rating. 

Table 8.  Overall Quality Ratings of LOs

LO


N


Mean

(1=poor, 4=excellent)

SD


Homework

45

3.58

.54

Quizzes

45

3.22

.67

PowerPoint slides

45

3.11

.91

Lectures

45

3.02

.81

Blackboard discussions

44

2.59

.84

Text

45

2.58

.92

Satisfaction.  Two measures were used to determine overall student satisfaction with this online course:  a standardized question on the general student course evaluation form distributed to all students at the end of every class and a question on the final online survey of the quarter that asked students whether they would recommend this particular online course.  Table 9 shows the frequencies of responses to both items: 58 students completed the course evaluation administered by the University; of those, 86.2% said that the course was outstanding or good.  About the same percentage of students who answered the recommend question on the final course survey (86.7%) said that they would recommend the course.  Together, these two questions provide compelling evidence to support the claim that students in this online course were overwhelmingly satisfied.


Table 9.  Overall Rating and Likelihood to Recommend

Evaluation item

Frequency (percent)

Overall course rating

     Outstanding
     Good
     Fair
     Poor


26 (44.8%)
24 (41.4%)
  5 (8.6%)
  3 (5.2%)

Would recommend the course

    Yes
    No


39 (86.7%)
  6 (13.3%)


Discussion

Because of the challenges of notation and intricacy of content, mathematics is one of the most challenging disciplines to offer online.  However, the availability of rich, publisher-supported online homework sites such as CC/MML and software such as Acustudio has made the creation of LOs for teaching 
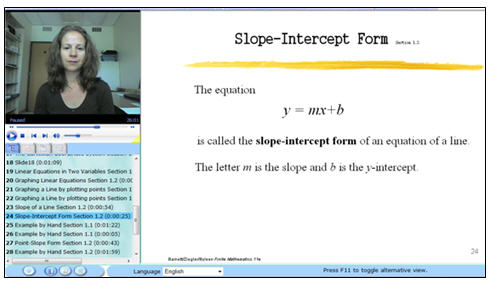
mathematics relatively easy. Acustudio makes possible the creation of rich online lectures that, in the past, would have required extensive instructional technology design support.  The ability to show hand-worked examples using the “whiteboard” feature was key to the successful implementation of this software.  Students reported that the “examples by hand” created utilizing the whiteboard were an especially useful component of 
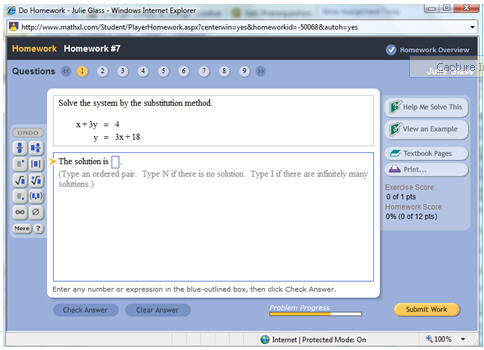
the lectures.  However, far and away the most highly utilized and consistently preferred LO was the homework.   As shown in the screenshot in Figure 3, the CC/MML site offers a variety of tools for students completing homework assignments.  Students are able to view examples, request help solving a problem and link directly to relevant pages in the e-text.  In addition, students are given immediate feedback on their solutions.  This instant feedback speaks also to student preferences as described by Swan (2003).  If an incorrect solution is entered, students are able to solve a similar problem (generated by MML) for credit.  This rewards persistence and helps students become familiar with procedures and patterns found in solving certain types of problems.  CC/MML allows students to interact with the material in a manner that exemplifies the notion of active learning.   There is evidence (Bonwell & Eison, 1991; Sahin, 2007) that active participation in content leads to greater and longer lasting understanding of material.  Thus, in this online environment, the fact that students engaged with, perceived the values of, and spent a majority of their time doing homework is a positive outcome in terms of student learning online.   It would be interesting to compare student performance and preferences to that of a face-to-face class with the same credit structure that offers all the mentioned support mechanisms (including videos) and regular (in terms of time as well as delivery mode) class meetings.  This is an area of great interest and may be pursued for verification in future studies.

Another area of interest is the lack of value that students placed on the discussion portion of the class.  There were, in fact, two aspects of the discussion: a required component and an optional component.  The students were only asked to comment on the required component, which consisted of students responding to an instructor “prompt” (a question, problem or statement).  The 60 points total for discussion participation were distributed as follows:  3 responses (chosen by the student) were graded for quality (content and communication skills) by the instructor for a total of 30 points (10 points each).  The remaining 30 points were given based upon timely and consistent responses to the prompts throughout the quarter.  The prompts were designed to encourage students to think more deeply about the material and its applications.  Some sample prompts are:  “We know that two points determine a unique line.  What if you have 3 points?  How many distinct lines pass through at least 2 of the given points?  Is the answer always the same?  How do the various transformations (shifts, stretches and shrinks) affect the equation of a line and the graph of that line (think about the slope and y-intercept)?” and “Find two examples in the newspaper or online of automobile loan offers that require periodic payments and compare the offers.”  Thus we see that “discussion” is somewhat of a misnomer for this portion of the course that does not fit the traditional definition of “discussion.”  Students were encouraged to respond to each other’s postings but did not often do so.  On the other hand, there were optional discussion boards where students could post questions and comments about the course.  Because open discussion boards had only optional participation, it was not included in the weekly survey questions.  However, in the final survey, “Instructor responses to your discussion postings” was among the course components rated for quality and contribution to overall learning.  It is of note that for this final survey, the optional and required discussion boards were not distinguished.  In terms of quality, these instructor responses were rated 2nd only to the homework with a mean score of 3.25 (1 = poor, 4 = excellent, SD = .78) while the Blackboard discussions had a rating of 2.59 (SD = .84).  In terms of contribution to overall learning, Instructor responses were rated 5th (out of 7) for a mean of 3.64 (with 1 = not at all, 5 = a lot, SD = 1.46) while the Blackboard discussions ranked last overall with a mean score of 3.02 (SD = 1.37).

Features of a face-to-face class that were lost in this online course were useful office hour interactions between student and faculty and partial credit on students’ solutions.  While office hours were offered both online and face-to-face, students rarely took advantage of this availability.  The online office hours were offered in chat format, limiting the ability to use the required notation for useful interaction, and students generally could not travel to campus to attend face-to-face office hours.  It is certainly a difficult mode of communication for mathematics.  However, students did interact with the instructor and each other on discussion boards.  A potential solution to this problem is offered by a very promising communication software package titled enVision.  This software allows for anonymous online communication between students and faculty with rich notational availability.  One study (Hooper, et. al., 2006) reports that enVision sessions are more effective than traditional office hours.  The software (freeware) allows any number of students to “attend” an online office hour and participate, or lurk, as they choose.  Several strengths of the software are described as “Anonymity”, “Engagement and multi-way dialog” and “Passive participation.”  Incorporation of enVision into future offerings of the course here are being considered. 

Students’ open-ended comments about their online learning experience revealed that there was a great deal of disappointment over the lack of partial credit in the online homework.  This will be addressed in future offerings of the course by requiring the final exam to be a traditional “paper and pencil” exam, graded by the instructor.  There is also impressive work being done on creating and incorporating partial credit in computer-aided homework grading (Ahton, et. al., 2006) and (Livne, et. al., 2007).  If these processes were to come to fruition, it would greatly enhance the online homework services currently offered. 

Conclusions

The preference, satisfaction, and perceived impact on learning reported by students in this online class are encouraging for students and instructors of online mathematics courses.  Students clearly felt that the course was demanding though time consuming.  A large majority of the students rated the class as good or outstanding (50 out of 58) and an even greater majority found the class to be intellectually challenging (54 out of 58).  This demonstrates that the course, while requiring a lot of work, was perceived as successful by most students.  The strong preference for the active learning LO homework coupled with the perceived impact on learning of the lectures lead to the overall impression that the online environment offered these students an extensive, flexible and rich learning experience.  While there are some areas of concern, the rate at which tools for instruction online are being developed leads the authors to believe that many will be addressed in due time.  The findings in this paper point to a best practices model for online mathematics that strongly utilizes practice problems with fast feedback and integrates tools for content delivery such as media-enhanced lectures.  This combination of LOs will provide students with the tools that they need to succeed online. 

Acknowledgements 

Both authors are grateful for funding from the Faculty Support Grants Program at CSUEB.  The first author also thanks the members of the FLC for Best Practices in Online Teaching and Learning and the members of the FLC for the Scholarship of Teaching and Learning.  The authors appreciated the reviewers’ comments and have incorporated their suggestions.  We feel this has made a stronger paper. 


References

Ahton, H., Beevers, C., Korabinski, A. & Youngson, M.  (2006) Incorporating partial credit in computer-aided assessment of Mathematics in secondary education.  British Journal of Educational Technology, 37(1), 93-119.

Bennett, K. & McGee, P.  (2005).  Transformative power of the learning object debate.  Open Learning, 20(1), 15-30. Bonwell, C. & Eison, J. (1991).  Active learning:  Creating excitement in the classroom.  ASHEERIC Higher Education Report No. 1, George Washington University, Washington, D.C.

Cuthrell, K. & Lyon, A.  (2007).  Instructional strategies:  What do online students prefer?  MERLOT Journal of Online Learning and Teaching, 3(4), 357-362 (https://jolt.merlot.org/documents/cuthrell.pdf)

Dennen, V.  (2008).  Pedagogical lurking:  Student engagement in non-posting discussion behavior  Computers in Human Behavior, 24(4), 1624-1633.

Ellis, T. & Cohen, M.  (2005).  Building the better asynchronous computer mediated communication system for use in distributed education.  Proceedings of the 35th Frontiers in Education Conference (pp T3E15-T3E20).  Piscataway, NJ:  IEEE.

Friesen, N.  (2003).  Three objections to learning objects.  Available online at:  phenom.edu.ualberta.ca/˜nfriesen (accessed May 2008). Hodgins, W.  (2000).  Into the future.  Available at:  http://www.learnactivity.com/download/MP7.PDF, p27.

Hooper, J., Pollanen, M. & Teismann, H.  (2006).  Effective Online Office Hours in the Mathematical Sciences.  MERLOT Journal of Online Learning and Teaching, 2(3), 187-194 (https://jolt.merlot.org/vol2no3/hooper.pdf

Liber, O.  (2005).  Learning objects:  Conditions for viability.  Journal of Computer Assisted Learning, 21, 366-373.

Livne, N., Livne, O. & Wight, C.  (2007).  Can Automated Scoring Surpass Hand Grading of Students’ Constructed Responses and Error Patterns in Mathematics?  MERLOT Journal of Online Learning and Teaching, 3(3), 295-306 (https://jolt.merlot.org/vol3no3/livne.pdf)

Parish, P.  (2004). The trouble with learning objects.  Educational Technology Research and Development, 52(1), 49-61.

Pelz, B.  (2004).  Three principles of effective online pedagogy.  JALN 8(3), retrieved May 2008 from http://www.sloan-c.org/publications/JALN/v8n3/v8n3_pelz.asp

Prince, M. (2004). Does active learning work? A review of the research.Journal of Engineering Education, 93(3), 223-231.

Saba, F.  (2005).  Critical issues in distance education:  A report from the United States.  Distance Education, 26(2), 255-272. Sahin, I.  (2007).  Predicting student satisfaction in distance education and learning environments.  (ERIC Document Reproduction Service No. ED 496541).

Swan, K.  (2003).  Learning effectiveness:  What the research tells us.  In J. Bourne & J. Moore (Eds.) Elements of Quality Online Education, Practice and Directions.  Needham, MA:  

Sloan Center for Online Education, 13-45. Wiley, D.  (2002).  Connecting learning objects to instructional design theory:  A definition, a metaphor, and a taxonomy.  In D. Wiley (Ed.) The Instructional Use of Learning Objects.  The Agency for Instructional Technology, Bloomington, IN, 4.


Manuscript received 30 May 2008; revision received 18 Aug 2008.

Creative Commons License

This work is licensed under a

Creative Commons Attribution-NonCommercial-ShareAlike 2.5 License


Copyright © 2005-2008  MERLOT. All Rights Reserved.
Portions Copyright by MERLOT Community Members. Used with Permission.
ISSN: 1558-9528
Questions? Email: jolteditor@merlot.org
Last Modified : 2008/9/15