The Efficacy of Online Exam-Review Sessions:
Reaching Both High- and Low-Performing Students
|
Rachel Sturm-Beiss
Associate Professor
Department of Mathematics and Computer Science
Kingsborough Community College
New York, NY 11235 USA
rachel.sturm-beiss@kbcc.cuny.edu
Abstract
Teaching mathematics in a class comprised of students with varying levels of preparation and aptitude poses a significant challenge: How does one keep the top performers engaged without losing those who are struggling? In an effort to accommodate commuter students with little schedule flexibility, screencast videos made accessible on YouTube were used as means to deliver optional exam-review sessions in two pre-calculus classes. The screencasts were introduced before the second exam; thereafter, several poor performers began to score better and appeared more motivated in class. Students in both classes completed brief surveys regarding their preparation for the first two in-class exams. An analysis of survey data together with test grades showed that 55% of the students viewed the entire screencast series and that high- and low-performing students viewed the videos in equal proportions. The mean standardized grade of the student group who watched the entire video series increased significantly from the first exam to the second exam. Subsequently, in an effort to promote autonomous mathematical problem-solving skills the author experimented with videos containing embedded math exercises. Positive student feedback suggests that this type of teaching medium is beneficial to and appreciated by the motivated student.
Keywords: screencasting, video, instructional engagement, teaching ancillaries, mathematics education |
Introduction
Increasing the level of student engagement and performance in a predominantly minority commuters' college, whose student body is mainly comprised of mature-aged, working students, can be challenging. Such students typically have extensive family obligations that limit the time available for studying, and for time- and/or location-specific activities that are not stipulated as course requirements (such as extra tutoring offered outside of class time). Initially created during a shortened semester to save classroom time, the author designed supplementary exam-review video sessions via screencasts viewable from any location and at any time. Screencasts (O'Malley, 2010) are digital recordings of computer screen activity overlaid with audio commentary. The exam-review screencasts, introduced in two pre-calculus classes before the second in-class exam, were enthusiastically received. Several poor performers began to score better on tests and appeared more motivated in class. In an effort to verify anecdotal findings the author asked students in both pre-calculus classes to complete brief surveys regarding their preparation for the first two in-class exams. An analysis of survey data showed that high-performing and low-performing students viewed the videos in equal proportions. The mean standardized grade of the student group that watched the entire video series increased significantly from Exam 1 to Exam 2. In subsequent semesters the author, guided by students' requests, continued to create screencasts for exam-review and to supplement classroom instruction. Videos containing embedded exercises received the most positive feedback.
In this paper, the author reports on a case study of instructor created screencasts, placed on YouTube, as classroom instruction ancillaries. Data obtained from class surveys and student exam and quiz scores is analyzed in order to address the following questions:
- Were the (optional) screencasts viewed by most of the students?
- Did grades improve after viewing the screencasts?
- Is there an association between level of achievement and video viewing? That is, were high achievers more likely to watch the screencasts or did high and low performers view the videos in equal proportions?
The Literature Review section that follows cites numerous studies that document the success of online videos/screencasts as a supplement to in-class instruction.
Literature Review
The Educational Benefits of Screencasting
Online videos, and in particular screencasts created with personal broadcast software such as Camtasia Studio, have been used as teaching media with increasing frequency in recent years. The free, non-profit educational website Khan Academy helped to popularize the screencast as a pedagogical tool. In the ensuing years, instructors across diverse academic disciplines use this medium to supplement in-class lectures. The EDUCAUSE Center for Applied Research, in their 2012 Study of Undergraduate Students and Information Technology, reported that 80% of students in the United States think they learn more in a course with an online component (Dahlstrom, 2012). In particular, approximately 40% (up from 20% in 2011) of students expressed a wish for more podcasts/webcasts in their courses; approximately 18% wished for less podcast/webcast content (Dahlstrom, 2012).
At James Cook University in Australia, the screencast was introduced in order to accommodate mathematics students who were physically unable to attend every lecture (Mullamphy, Higgins, Belward, & Ward, 2010). The authors outline a variety of advantages of screencasting such as flexible accessibility, the possibility of replaying and pausing, and the ability to track views and monitor activity. In addition, the University's mathematics major was enhanced by the scheduling of additional, advanced online screencasted courses that did not have sufficient enrollment to run in a traditional classroom setting.
Loch, Gill, and Croft (2012) discuss the use of screencasts in mathematics support centers in Australia, Ireland, and the United Kingdom. Changes in high school mathematics standards have increased the flow of students with weak mathematical skills. Screencasts provide these students with help when they need it. The authors emphasize that screencasts alone are not adequate substitutes for one-on-one support provided by tutors.
Screencasts are especially well suited to the dynamic representation of mathematics notation and diagrams (Feinstein, 2010; Loch, 2010). The social entrepreneurship company Coursera uses screencasts for teaching in its massive open online courses on college algebra and pre-calculus.
The Screencast and Assessment Feedback
Screencasts have been used as an assessment feedback tool. Short videos communicating feedback to an individual student are often more informative than a static marked-up paper. At The University of Manchester in the U.K., screencasts of tutorials used in conjunction with individualized student assessment feedback create an enhanced teaching experience for the lecturer and an enhanced learning experience for the student (O'Malley, 2012).
Martin (2012) reports on the usage of teaching with screencasts containing embedded exercises. In the teaching of his classes his experience suggests that the resulting interactive work increases both student engagement and learning.
The Online Video as a Supplement to Classroom Instruction
The University of Stirling in the U.K. was among the first to conduct a case study designed to explore the efficacy of the screencast as an ancillary for classroom lectures. Feedback from a student survey was very positive, with flexibility and the ability to repeat lectures often mentioned as advantages (Winterbottom, 2007). In some classes online videos can be used to explain concepts that are difficult to convey in the traditional classroom setting. In a third-year chemistry course taught at Thailand's Ubon Ratchathani University, students volunteered to view online animated videos as a self-learning supplement covering the conceptually difficult topic of nuclear magnetic resonance (NMR) spectroscopy (Supasorn & Vibuljan, 2009). After completing the course the students who viewed the videos demonstrated a greater understanding of NMR spectroscopy than those who did not.
Some topics are easier to demonstrate on a screencast than on a blackboard. The following is a link to a screencast from a Calculus class in which the "Squeeze Theorem" is proved: https://www.youtube.com/watch?v=7NEwkyuOVQY. At the 2-minute mark, one can see how editing software with layering capability overlays and separates geometrical shapes central to the proof of the theorem.
Online Exam Reviews
Online resources for test preparation are ubiquitous in all disciplines. On commuter campuses, where students have tight scheduling constraints online resources are more accessible than those requiring a time or location commitment. Guertin (2010) reports on the teaching of geosciences courses at Penn State Brandywine, a commuter campus. To meet the challenge of scheduling exam-review sessions Guertin creates podcasts with sample questions that provide students with flexible mobile learning opportunities. Student survey feedback was very positive.
Researchers at The Open University in the U.K. undertook a project for investigating and evaluating the effectiveness of short screencasts as educational support resources for students who are part-time distance learners (Jordan, Loch, Lowe, Mestel, & Wilkins, 2012). Many of these students studied the prerequisite topics earlier in their academic career, and the screencasts served to refresh their mathematics skills and review currently studied topics. The authors investigated the impact of screencast viewing on exam scores. After dividing the students into two (self-selected) groups they found that students who watched the screencasts before the test performed marginally better than those that did not. The authors also discovered that students appreciate screencasts that embody a "personal touch." Of 47 respondents to a student survey, 24 showed a preference for handwritten, 18 were undecided, and only five preferred typewritten. Some students commented that a mixture of the two felt most natural.
One of the disadvantages of lectures delivered by screencasting is the lack of exchange between students and the instructor or students and their peers. Donovan and Loch (2013) report on their experiences teaching large exam-review mathematics classes in a computer lab where each student is provided with a tablet-enabled personal computer. They describe an atmosphere of "active learning" created with this technology. Students can display their solutions anonymously for review by peers and the instructor, and more time is spent doing exercises than listening to lectures. It would be interesting to offer a class that combines both screencasts for lecture delivery and active learning in tablet-enabled labs.
Potential Problems
For the beginner, screencast creation can be very time consuming (Jordan et al., 2012). Writing clearly with a tablet pen may require several hours of practice. During the creation process, one slip of the pen or tongue requires the remake of a video. On the author's laptop, the screen capture software requires approximately 4 to 5 minutes to produce a 5-minute video.
One of the potential problems of providing screencasting is the possibility that attendance at tutorials and lectures may decrease. Mullamphy et al. (2010) point out that this might be part of the "flexible delivery" in action. However, most educators with screencast experience seem to agree that attendance in tutorials cannot be replaced by the passive viewing of a screencast.
Yoon and Sneddon (2011) investigated patterns in the use of recorded lectures in two large undergraduate mathematics courses and in particular the concern that recorded lecture availability would result in lower class attendance. They found that students who intended to watch more recorded lectures than they actually did achieved significantly lower grades; however, missing live lectures intentionally because recordings were available was not associated with the final grade.
Methods
The Student Population
Kingsborough Community College (KCC) is a commuter campus that is part of the City University of New York system. It has a diverse, mature student population, with an average student age of 26. Many students of the College have spouses and children and most work part time. As a result, they have little schedule flexibility.
Data Collection
During a shortened semester, with the intent to accommodate all students, the author prepared five short screencasts as review for the second in-class exam. The screencasts were made with screen capture software, a digital pen, a tablet, and a microphone. Students were asked to complete a brief survey about their preparation for the first two in-class exams. They reported the number of hours studied for each of the two exams and the proportion of review videos viewed (all, at least half, less than half, or none) in preparation for the second exam.
There were 44 students enrolled in both classes. A total of 36 students from two pre-calculus classes participated in the survey on screencast viewing and exam preparation. Eight foreign students from both classes were removed from the study. These students had taken pre-calculus and more advanced courses in their home countries. They did well on exams without any form of studying. The survey results were analyzed together with exam and quiz scores.
Data Analysis Methods and Procedures
Table 1 contains the list of variables considered in the analysis. Due to the small size of the study the students were divided into only two (self-selected) groups according to the variable Rev (screencast viewing category; see Table 1). A linear model with the standardized Exam 2 score as a dependent variable and with the standardized Exam 1 score and Rev as independent variables was found to be significant. Furthermore, the coefficient of the variable Rev was positive and significant. This indicates that screencast viewing was associated with improved exam scores.
Table 1. List of variables
Variable Name |
Description |
Rev |
A factor variable with two levels representing the proportion of videos viewed (1 = all, 0 = less than all)
|
QFactor |
A two-value factor variable that divides the class into above average and below average performers (0 = below, 1 = above)
|
ZT1 |
The z-score for Exam 1 (standardized score)
|
ZT2 |
The z-score for Exam 2 (standardized score)
|
DIFF |
The difference between the z-scores of Exam 2 and Exam 1; this variable represents grade improvement from grade 1 to grade 2. |
|
DIFF values of the subgroup of students who viewed less than all of the videos. |
DIFF1 |
DIFF values of the subgroup of students who viewed all of the videos. |
A cross tabulation of variables Rev and QFactor (a measure of ability based on quiz scores; see Table 1) shows that the Rev variable was not associated with overall ability. This suggests that high- and low-performing students viewed the videos in equal proportions.
Results
The high- and low-performing students viewed the videos in approximately equal proportions. Of the 36 students, 10 out of 17 below-average students (determined by variable QFactor; see Table 1) and 10 out of 19 above-average students viewed the complete series of review videos.
The variable DIFF (see Table 1) captures the difference between a student's standardized Exam 2 and standardized Exam 1 scores. A positive DIFF value indicates improvement from Exam 1 to Exam 2. Figure 1 shows a scatterplot of DIFF values versus Rev (see Table 1) values. The DIFF values in the group that viewed all the videos appear to be shifted up, which suggests that this group improved from Exam 1 to Exam 2.
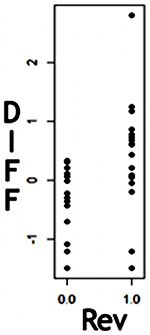
Note. The spread of DIFF values for Rev = 1 is shifted up. This indicates that on average, students who viewed all the review videos improved their grades.
Figure 1. A scatter plot of DIFF (Exam 2 z-score - Exam 2 z-score) values versus Rev values (1 = all videos viewed, 0 = fewer than all viewed)
A t-test indicated that the mean difference between the standardized Exam 2 and Exam 1 scores for the group that viewed the entire set of screencasts was significantly greater than zero (p = .062). A second t-test indicated that the group that viewed the entire set improved more that the group that did not view the entire set (p = .0059). Thus, screencast viewing appears to be associated with grade improvement. (See Appendix A for the statistical software output.)
Figure 2 displays a plot of standardized Exam 1 scores versus standardized Exam 2 scores. The observations are labeled according to screencast viewing. Notice the upward trend and that the observations belonging to the group that viewed the entire set of screencasts, labeled with a "1," are usually above those labeled with a "0." The upward trend suggests that performance on the second exam is positively correlated with performance on the first exam. The grouping of the observations labeled with a "1" above those labeled with a "0" suggests that screencast viewing is associated with a higher score on Exam 2 after performance on Exam 1 is taken into account.
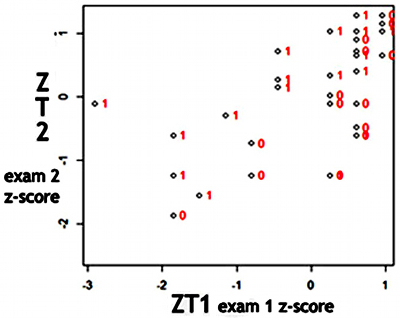
Note. The plot has an upward trend and the points labeled with "1" (Rev = 1) are usually above those labeled with a "0" (Rev = 0), indicating that the Rev = 1 group did better than the Rev = 0 group when overall ability (captured in ZT1) is taken into account.
Figure 2. A plot of ZT2 (Exam 2 z-score) versus ZT1 (Exam 1 z-score) with points labeled with values of Rev (1 = all videos viewed, 0 = fewer than all)
Two linear regression models each, with a dependent variable equal to the standardized Exam 2 score, were considered. The first model has one independent variable: the standardized Exam 1 score. The second model has two independent variables: the standardized Exam 1 score and the variable Rev (a measure of screencast viewing; see Table 1). Both models are significant, but the second model, with the variable Rev included, is more significant (p = .000057 for the second model and p = .00012 for the first model). In the second model the variable Rev is significant (p = .0292). The significance of the second model and the significance of the variable Rev indicate that screencast viewing is associated with a higher Exam 2 grade when Exam 1 is taken into account. (See Appendix A for the statistical software output.)
Discussion
The author found that high-performing and low-performing students viewed the optional online review videos in equal proportions. It is the author's experience that low-performing students usually participate less than high-performing students in optional grade improving initiatives. Both ease of access and the anonymity of the video medium may contribute to the uniform viewing across the performance spectrum. Many low-performing students are timid about availing themselves of College resources such as the Math Workshop (which provides free professional tutoring to all KCC students who are enrolled in a math class). The anonymity aspect of online help may be attractive to the timid student. Furthermore, the online video medium is a natural place for students to seek assistance. Students are becoming increasingly reliant on online resources such as educational videos offered on YouTube and recorded classes such as those available through the MIT OpenCourseWare project (Hrastinski & Aghaee, 2012).
The collective enthusiasm for the online exam-review videos prompted the author to create screencasts for topics that, due to time constraints, could not be covered in class. In subsequent screencasts the author added embedded exercises that were similar to exercises explained in the video. Many students commented that they especially appreciated this interactive component. Statistics from YouTube indicate that most students continued to participate in the optional online reviews and to a lesser extent in viewing optional topics not covered in class.
Conclusion
Offering students alternate teaching mediums has the effect of reaching more students and increasing achievement. Students with little schedule flexibility may appreciate the option for viewing screencasts at any time and from any location. In particular, the author has found that providing online instruction in the form of a screencast to supplement traditional classroom instruction is a medium that reaches both high and low achievers and students with little schedule flexibility. The results of the student feedback survey suggest that providing students with screencasts for exam preparation is associated with increased student performance.
This case study is limited in scope and certainly a broader study is necessary to reach definitive conclusions about the success of optional screencasts as an effective learning tool. In particular the author did not have a control group of students exposed to an in-class review session. Since students who watched the screencasts were self-selected, one might reasonably assume that the more motivated students access more resources. The quality of screencasts is not uniform, and it is not possible to make broad statements about their pedagogical value. It would be interesting to investigate the extent of the general trend towards student reliance on online videos as supplement to the classroom experience. Furthermore, it would be useful to determine what type of videos or screencasts students find most helpful. For example, do they prefer screencasts with static input such as PowerPoint slides or handwritten input from a digital pen and tablet, or perhaps a combination of both (Jordan et al., 2012)?
In summary, the screencast is a valuable teaching medium for supplementing classroom lectures. The screencast used as an online resource has the potential for reaching more students and as a result may successfully engage students who cannot participate in (optional) time or location specific learning activities.
References
Dahlstrom, E. (2012). ECAR study of undergraduate students and information technology, 2012. Louisville, CO: EDUCAUSE Center for Applied Research. Retrieved from http://net.educause.edu/ir/library/pdf/ERS1208/ERS1208.pdf
Donovan, D., & Loch, B. (2013). Closing the feedback loop: Engaging students in large first-year mathematics test revision sessions using pen-enabled screens. International Journal of Mathematical Education in Science and Technology, 44(1), 1-13. doi:10.1080/0020739X.2012.678898
Feinstein, J. (2010). Using a tablet PC and screencasts when teaching mathematics to undergraduates. In M. Robinson, N. Challis, & M. Thomlinson (Eds.), Maths at university: Reflections on experience, practice and provision (pp. 118-120). Birmingham, UK: More Maths Grads. Retrieved from http://maths.sci.shu.ac.uk/moremathsgrads/MMG_Book/5-4%20UsingATabletPCAndScreencastsFeinstein.doc
Guertin, L. A. (2010). Pre-recorded online audio review sessions. College Teaching, 59(1), 45. doi:10.1080/87567550903252561
Hrastinski, S., & Aghaee, N. M. (2012). How are campus students using social media to support their studies? An explorative interview study. Education and Information Technologies, 17(4), 451-464. doi:10.1007/s10639-011-9169-5
Jordan, C., Loch, B., Lowe, T., Mestel, B., & Wilkins, C. (2012). Do short screencasts improve student learning of mathematics? MSOR Connections, 12(1). 11-14. doi:10.11120/msor.2012.12010011
Loch, B. (2010). What do on campus students do with mathematics lecture screencasts at a dual-mode Australian university? In D. Green (Ed.), Proceedings of the CETL-MSOR Conference 2009 (pp. 43-47). York, UK: The Higher Education Academy Maths, Stats & OR Network. Retrieved from http://www.heacademy.ac.uk/assets/documents/subjects/msor/Proceedings_2009_Upload_0.pdf
Loch, B., Gill, O., & Croft, A. C. (2012). Complementing mathematics support with online MathsCasts. ANZIAM Journal, 53, C561-C575. Retrieved from http://journal.austms.org.au/ojs/index.php/ANZIAMJ/article/view/4984/1649
Martin, F. G. (2012). Will massive open online courses change how we teach? Communications of the ACM, 55(8), 26-28. doi:10.1145/2240236.2240246
Mullamphy, D. F., Higgins, P. J., Belward, S. R., & Ward, L. M. (2010). To screencast or not to screencast. ANZIAM Journal, 51, C446-C460. Retrieved from http://journal.austms.org.au/ojs/index.php/ANZIAMJ/article/download/2657/1333
O'Malley, P. J. (2010). Combining a tablet personal computer and screencasting for chemistry teaching. New Directions, 6, 64-67. doi:10.11120/ndir.2010.00060064
O'Malley, P. J. (2012). Screencasting and a tablet PC – an indispensable technology combination for physical science teaching and feedback in higher and further education. In Aiming for excellence in STEM learning and teaching: Proceedings of the Higher Education Academy's First Annual Learning and Teaching STEM Conference. York, UK: The Higher Education Academy. Retrieved from http://www.heacademy.ac.uk/assets/documents/stem-conference/PhysicalSciences/Patrick_OMalley.pdf
Supasorn, S., & Vibuljan, S. (2009), Use of an interactive NMR spectroscopy course to enhance the NMR understanding of university students. MERLOT Journal of Online Learning and Teaching, 5(3), 458-468. Retrieved from https://jolt.merlot.org/vol5no3/supasorn_0909.htm
Winterbottom, S. (2007). Virtual lecturing: Delivering lectures using screencasting and podcasting technology. Planet, 18, 6-8. doi:10.11120/plan.2007.00180006
Yoon, C., & Sneddon, J. (2011). Student perceptions of effective use of tablet PC recorded lectures in undergraduate mathematics courses. International Journal of Mathematical Education in Science and Technology, 42(4), 425-445. doi:10.1080/0020739X.2010.543165
Appendix A: Statistical Software Output
T-Tests
The output below shows an analysis of the variable DIFF, which is the difference between the Exam 2 and Exam 1 z-scores. DIFF1 represents the DIFF values of those students who viewed all videos, while DIFF0 represents the values of those students who viewed fewer than all videos. The first t-test (output shown on the left) indicates that the mean of DIFF1 is significantly greater than 0. The p-value, .06288, is significant at a level of .10 (type I error). The second t-test (output shown on the right) indicates that the means of DIFF0 and DIFF1 differ significantly.
> t.test(DIFF1,conf.level=.90)
One Sample t-test
data: DIFF1
t = 1.9827, df = 18, p-value = 0.06288
alternative hypothesis: true mean is not equal to 0
90 percent confidence interval: 0.05163684
0.77192949
sample estimates:
mean of x (DIFF1)
0.4117832
|
> t.test(DIFF1,conf.level=.90)
Welch Two Sample t-test
data: DIFF0 and DIFF1
t = -2.9604, df = 30.519, p-value = 0.005896
alternative hypothesis: true difference in means is not equal to 0
95 percent confidence interval: 0.05163684
-1.2672899 -0.2330224
sample estimates:
mean of x (DIFF0) mean of y (DIFF1)
-0.3383730 0.4117832
|
Linear Models
The first linear model (output shown on the left) uses ZT2 (Exam 2 z-score) as the dependent variable and ZT1 (Exam 1 z-score) as the predictor variable. In the second linear model (output shown on the left), ZT2 is again the dependent variable, but the predictor variables are ZT1 (Exam 1 z-score) and Rev (two-value factor variable reflecting video viewing).
lm(formula = ZT2 ~ ZT1)
Residuals:
Min 1Q Median 3Q Max
-1.4535 -0.4765 0.1829 0.5391 1.4283
Coefficients:
Estimate Std. Error t value Pr(>|t|)
(Intercept) 0.07755 0.12556 0.618 0.541178
ZT1 0.55424 0.12568 4.410 0.000109 ***
---
Signif. codes: 0 '***' 0.001 '**' 0.01 '*' 0.05 '.' 0.1 ' ' 1
Residual standard error: 0.7321 on 32 degrees of freedom)
(2 observations deleted due to missingness)
Multiple R-squared: 0.378, Adjusted R-squared: 0.3586
F-statistic: 19.45 on 1 and 32 DF, p-value: 0.0001093
|
lm(formula = ZT2 ~ ZT1 + Rev)
Residuals:
Min 1Q Median 3Q Max
-1.7190 -0.3806 0.1038 0.3318 1.3824
Coefficients:
Estimate Std. Error t value Pr(>|t|)
(Intercept) -0.2355 0.1808 -1.303 0.2023
ZT1 0.6239 0.1220 5.115 1.55e-05 ***
Rev 0.5611 0.2454 2.286 0.0292 *
---
Signif. codes: 0 '***' 0.001 '**' 0.01 '*' 0.05 '.' 0.1 ' ' 1
Residual standard error: 0.6881 on 31 degrees of freedom)
(2 observations deleted due to missingness)
Multiple R-squared: 0.4678, Adjusted R-squared: 0.4334
F-statistic: 13.62 on 2 and 31 DF, p-value: 5.685e-05
|