|
Introduction
With the tremendous growth in the popularity of websites focusing on social activities and collaboration, it is appropriate to consider how these types of activities might be used to benefit teaching and learning. Web services, such a wikis, blogs, and social networking websites illustrate the current trend toward the use of collaborative exploration and contribution of information and commentary in popular culture, as well as academic environments. These services are collectively referred to as “Web 2.0” to further demonstrate a change in the manner in which the Internet and websites are being used. Web 2.0 has been described by stating “the Web of documents has morphed into a Web of data…we’re looking to a new set of tools to aggregate and remix microcontent in new and useful ways”(MacManus & Porter, 2005). This new generation of web-based services is characterized by both the highly efficient and interactive user interface designs as well as the “ability to harness collective intelligence” (O'Reilly, 2005).
While the use of collaboration tools such as wikis, blogs, and other such resources has found a way into many K-12 and higher education classrooms, not all social and collaborative web services have such a direct path into the process of teaching and learning. The concept of social content web services is one such type of application. Among the more popular social content websites are the digg.com, del.icio.us, and reddit.com websites which enable users to contribute links to other news sources, blogs, video content, and other types of media that is the rated by other users, most commonly by casting a positive or negative vote for a recently posted link. This concept of collecting and categorizing information sources is certainly nothing new in an educational setting. However, the focus of social content sites on the contributions of the network of users in locating and evaluating content, thus relinquishing control of the content of a site over to this network of users, is certainly a new take on the idea. Both Bull (2005) and Lomas (2005) describe this as a dramatic change in the way users interact with content. It is this unique connection of social interaction with a focus on sharing and collaboration towards a common goal among users with a shared interest that makes the social content strategy very appealing in an educational environment.
This paper discusses the implementation and evaluation of a pilot project that used a social content strategy in an undergraduate course focusing on educational technology. This social content web-based system was implemented in order to increase students’ awareness of a wider range of issues relating to the use of technology in education than would be possible through more traditional means such as a required reading list, etc. The primary focus of this pilot study is to discern usage patterns and feedback from students who were engaged in a social content activity for approximately 10 weeks of a 16 week course. The information gathered through this study on user behavior within the website will guide the next stages of development and assist in establishing specific research questions to be addressed in future studies with the ultimate goal of determining effective ways of integrating this type of technology-enhanced activity into both more traditional and Internet-based courses.
Planning for implementation
In planning for the implementation of a user driven social content website in a higher education environment, the first decision to be made was whether to use an existing system, such as digg.com or del.ico.us, or whether it would be advantageous to have a separate system specifically for the students. While participating in an existing system would offer the advantages of an existing large network of users, it also increased the likelihood that the content posted by the students would be less prominent within the system. Due to the high number of users in established systems, students would be less likely to locate items posted by other students in the course, thus decreasing student interaction. Additionally, it would be more difficult to track individual users within an existing social content system and nearly impossible to identify usage patterns due to the inaccessibility of the raw usage data. Most relevant to this decision, however, was the issue of the focus of a social content system. Even though systems did exist that focused on sharing technology-related information, none of the available social content networks focused on educational technology specifically. As such, it was necessary to seek opportunities to implement a social content system in which the students in the course were the primary participants and content contributors and the focus would be more closely linked to the objectives of the course in which the system would be implemented.
The second decision to be made was between using existing software to create the social content system. At the time that this project was developed, there were a few open source systems that enable the creation of a separate social content system. Most notable among these options was the Pligg Content Management System available at http://www.pligg.com. Pligg offered a feature set very similar to the other social content websites and was designed to use PHP technology and a MySQL database. In preparing for the implementation of a social content system for the course, a Pligg-base system was installed and evaluated. However, it was increasingly challenging to identify specific usage patterns and retain the flexibility required to alter the system in the future based on the evaluation of the first implementation. Though the Pligg system did provide the source code to the software and the ability to make modifications, any changes that are more that simple user interface changes became difficult due to the complexity of the software design.
Based on the evaluation of the available open source systems, it was apparent that a custom-designed application would provide both the ability to track users and specific usage patterns and also provide the flexibility to redesign specific aspects of the system based on experiences during the first implementation. As such, a social content system was developed that used Adobe ColdFusion application services and a Microsoft SQL Server database system. While many web application services such as Active Server Pages, PHP, etc. would have also met these requirements, the ColdFusion technology was selected simply because the developer of the system had significant prior experience with this particular technology and an existing programming framework, thus making the initial development of the social content system faster and more efficient in this particular situation.
Overview of the social content system
Central to the concept of a social content system is the ability of users to contribute links and a brief description of content available elsewhere on the Internet. This content can be any type of resource available. Most commonly these resources are articles, blog postings, videos, and, in some cases, links to a website with many other resources. After a user contributed a resource, it is then added to the collection of available resource that is continually growing. Users are then able to rate these content items with either a positive or negative vote. Because the content displayed in the system is rated based on various information such as number of votes, time since the item was posted, etc., the main display of user contributed content is continually being updated as new information is added and additional ratings are made.
The main focus of the content system developed for this project was on presenting content from users with options to add new content and rate existing content. The social content system was initially designed to be very similar to other social content systems, while allowing for modifications that could be made based on this pilot study of the project.
Participants and requirements
During the initial implementation, there were approximately 75 students taking part in the activity, all of whom were third and fourth-year undergraduate students taking the course as a part of a teacher preparation program at a mid-sized university in the Midwest United States. As a graded activity, participants were required to post at least one content item during each of the nine weeks of the activity and were also required to vote on at least two content items that were submitted by another user each week. With regards to grading, this activity accounted for approximately 30% of each student’s final grade and regular and continued participation was a requirement of the activity. As such, a deduction of approximately 3% of the points available for this activity was assessed for each week that a student fell below the posting and voting requirements.
About the Site
 In order to address concerns of privacy and the possibility of abuse of the system by outside users, access to the site was restricted by a unique login for each student. Students were allowed to select their own username and password while creating a user profile in order to decrease the likelihood of forgotten passwords. A password recovery feature was also included that would email a password to the email account on record in the event of a lost password. In order to address concerns of privacy and the possibility of abuse of the system by outside users, access to the site was restricted by a unique login for each student. Students were allowed to select their own username and password while creating a user profile in order to decrease the likelihood of forgotten passwords. A password recovery feature was also included that would email a password to the email account on record in the event of a lost password.
The central challenge when creating the main user interface was developing a mechanism for sorting and ranking user contributed content. While most other social content systems have an algorithm for ranking user-contributed content, these algorithms are closely guarded proprietary information. Additionally, a unique algorithm would be necessary for this project in order to continually update the site based on a limited amount of user-contributed content. The main challenge was to develop a mechanism by which new postings would have an opportunity to be displayed on the “front page” even though older content was more likely to have more votes. A rating algorithm that relied solely on the number of votes an item received would result in a site where new content was rated much lower than older content. As such, new content would be less visible than older content and the site would be less likely to change much unless users were willing to navigate deeper into the site for new content. Ultimately, an algorithm was developed that rated items based on a combination of votes, visits by other users, age of posting, and the time since the most recent vote. Thus, items with many votes would be visible for a period of time, and then would be ranked lower as newer content was posted. While this algorithm is much simpler than those that are used by other social content sites, it was sufficient for the purpose of this site and did result in “rotating” content so that newer content was continually being presented on the front page of the site.
User Experience
Upon a successful login to the social content system, users were presented with the default view that consisted of a list of the recently popular content items (Fig. 1). These “recently popular” items were items that were ranked using the ranking algorithm and limited the list to items posted in the past two weeks. In a navigation bar at the top of the main web page were links to additional options through which users could submit a new link, view a list of their own votes, and view a list of the content items they had posted including current number of votes. These options allowed users to keep track of their activity within the system and to make sure they were meeting the minimum posting and voting requirements. This list of content items was separated into “pages” of ten items, with links at the bottom of the page that allowed for navigation to the next page or previous pages.
Users were also able to sort items according to the number of votes, the date the items were added (newest and oldest), as well as a list of items they had previously visited. A list of topics was also provided by which users could filter the list of items according to several categories. The categories available were:
· Technology Integration Ideas
·  Ed Tech News Ed Tech News
· Lesson Planning
· Teaching Strategies
· Ed Tech Research
· Software Tutorials
· Curriculum Resources
Users were able to post a new content item by clicking on the “Submit a New Link” button that was available on every page. A pop-up window was displayed in which a user would enter a title, URL, and a brief description for the content item (Fig. 2). Users were also required to select one or more topics in which the content item should be listed. Upon completion of this form, the URL of the item was compared with previously submitted items in order to identify possible duplication of a previously posted item.
A message was then displayed to the user indicating either a successful submission or a message indicating that the submission was a duplicate. Duplicate submissions were recorded in the database, but were not added to the content list.
Voting on each content item was conducted through the main content item list. Next to the title, link, description of the content item was a number indicating the current number of votes and also options to cast a positive or negative vote for the item (Fig. 3). By clicking on a green arrow point up, a user could cast a positive vote while clicking on the red arrow pointing down resulted in a negative vote. By using the “My Votes” link visible on each page, a user was also able to remove or change their vote in the event of an error.
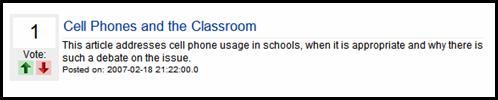
Figure 3: Sample Content Item display
Upon casting a negative vote, a user was also required to provide a reason for the negative vote using either a pre-written comment or by entering additional comments (Fig. 4). Users were prevented from casting multiple votes for one item. Users were also prevented from voting on a content item that they had not visited by way of an internal tracking system that recorded which links had been clicked on by the users.
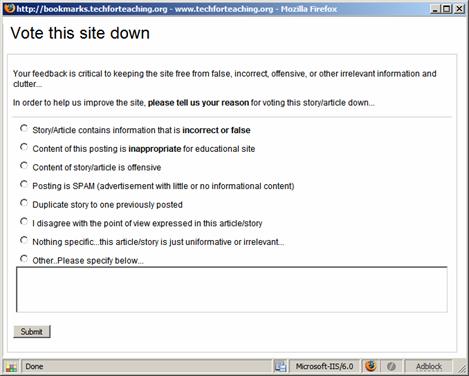
Figure 4: Submission form for casting a negative vote
User tracking
Because this system was designed to provide information relevant to usage patterns that would provide feedback on the future design of the system, much of the interaction within the system were recorded for future analysis. Using the tracking data that was collected within the system, it is possible to determine how deep users were navigating when viewing the content items. Additional information was also available to identify which of the sorting and filtering options were most commonly used. Table 1 includes a summary of the types of interactions that were recorded and a brief description of the means by which this information was collected.
Table 1. Usage data collected by internal user tracking system
Data |
Description |
User Logins |
Each login was recorded indicating a successful login with a date/time std>
|
Content Item visits |
Each click on a link to a content item was recorded in the database including the user ID, date/time stamp, and Site ID. In addition to providing data for usage analysis, this information was also used to prevent users from voting for sites they had not visited. |
Votes |
Both positive and negative votes were recorded. Negative votes included additional information regarding the reason for the negative vote. |
Page Sorting views |
Each page view was recorded indicating the type of sorting, page number, and topic that was selected. This information could be used to identify how “deep” users were navigating for content items. |
Topic List views |
A record was kept of the number of times a user selected any of the available topics. This also provided information regarding how users were attempting to sort through the available content items. |
Weekly Activity
Table 2. Weekly User Activity
Week |
Total Logins |
Total New items Added |
Total visits to content items |
Total votes cast |
Week 1 |
200 |
129 |
501 |
257 |
Week 2 |
105 |
78 |
235 |
162 |
Week 3 |
96 |
71 |
193 |
145 |
Week 4 |
94 |
70 |
179 |
144 |
Week 5 |
90 |
71 |
183 |
150 |
Week 6 |
101 |
69 |
188 |
152 |
Week 7 |
115 |
83 |
218 |
173 |
Week 8 |
144 |
93 |
192 |
195 |
Week 9* |
39 |
21 |
55 |
38 |
Total |
984 |
685 |
1944 |
1416 |
Mean |
109.3 |
76.1 |
216.0 |
157.3 |
* Technical difficulties experienced during week 9 likelyinfluenced usage data
Of particular interest were the rates of activity within the site throughout the nine week period in which participation was required (see Table 2). The primary data collected includes the total number of logins per week, total content items posted per week, total number of visits to sites posted by other users, and the number of votes cast per week. The most activity occurred during the first week and the least activity was recorded during the last week that the system was in use. The high activity during the first week was largely a result of introducing the activity to the student. The low activity in the last week was expected due to technical difficulties that were experienced with the site. With these two exceptions, activity remained at a relatively consistent level from the second to the eighth week.
In examining the activity data by weekday (Table 3), Thursday was the most active day throughout the nine week period with 535 logins, 353 new items added, 969 clicks to content item links, and 711 votes cast. The class was held on Thursday afternoons, which likely had an impact on the high rate of activity on that day. The lowest period of activity was on Friday, Saturday, and Sunday with a combined total of 80 logins, 49 new items added, 169 visits to content items and 119 votes cast. Across all categories of usage data, the combined total for these three days was lower than any other weekday total for the 9-week period.
Table 3. User Activity by Day of Week
Weekday |
Total logins |
# of new items added |
# visits to content items
|
# votes cast |
Monday |
91 |
58 |
182 |
123 |
Tuesday |
101 |
85 |
232 |
172 |
Wednesday |
177 |
140 |
392 |
291 |
Thursday |
535* |
353* |
969* |
711* |
Friday |
30 |
14 |
69 |
43 |
Saturday |
18 |
11 |
33 |
30 |
Sunday |
32 |
24 |
67 |
46 |
Total |
984 |
685 |
1944 |
1416 |
* indicates highest total within each category
Per user usage statistics
In addition to weekly summary usage statistics, it is also informative to examine per user statistics (Table 4). On average, users logged into the system approximately 13 times over the nine-week period. Seven students were among the most frequent visitors to the site with an average of 21-25 total logins. Approximately 88% of the students visited the site at least one or more times per week. Since the activity required weekly activity, about 12% of the users did not always meet this minimum requirement.
Table 4. Frequency of average login rates.
|
Frequency |
% |
Cumulative % |
0-5 |
1 |
1.3 |
1.4 |
6-10 |
19 |
25.3 |
27.0 |
11-15 |
35 |
46.7 |
74.3 |
16-20 |
12 |
16.0 |
90.5 |
21-25 |
7 |
9.3 |
100.0 |
Mean = 13.4, s = 4.38 |
he usage data for visits to content items (Table 5) indicate that, on average, students visited 27 content items during the nine-week period. The majority (64%) of students visited between 16 and 30 items while 10% visited less than 15 content items and approximately 25% visited 31 or more items. According to the user tracking data, one student visited 103 content items.
Table 5. Frequency of average visits to content items
Range |
Frequency |
% |
Cumulative % |
0-15 |
8 |
10.7 |
10.7 |
16-30 |
48 |
64.0 |
74.7 |
31-45 |
17 |
22.7 |
97.3 |
>45 |
2 |
2.7 |
100.0 |
Mean = 26.5, s = 12.33 |
|
With regard to voting on the content items the students visited, the overall average was 19.3 votes cast with and average of 17.8 positive votes and 1.5 negative votes (Table 6). According to the data, users were far more likely to cast positive votes than negative votes. Further, each user received an average of 17.8 positive votes and 1.5 negative votes for the content items that they had posted. While it is surprising that the averages for the types of votes cast and received are identical, the data does indicate that there is higher variability in the averages of positive votes received and negative votes cast.
Table 6. Per User voting statistics
|
All Votes Cast |
Positive Votes Cast |
Negative Votes Cast |
Positive Votes Received |
Negative Votes Received |
Mean |
19.3 |
17.8 |
1.5 |
17.8 |
1.5 |
SD |
4.92 |
4.55 |
2.08 |
11.86 |
1.67 |
High |
39 |
32 |
11 |
54 |
7 |
Low |
6 |
6 |
0 |
0 |
0 |
|
Usage Statistics for Navigational Options
Of particular importance to the design of the system overall was the usage statistics for the various navigation options. Within the system, it was possible to both filter and sort items in order to limit or reorganize the list of content item. The usage data indicate that the vast majority of page views (75%) did not employ any of the sorting or filtering options (Table 7). The most popular sorting option used the “Newest” option to display all content items listing the newest items first. The most popular filtering option limited the display to only those items posted by the logged-in user.
Because it was also possible to limit the list of content items to a particular topic, the usage data for these options provided further insight into the navigational preferences of the users (Table 8). Similar to the filtering and sorting options, the majority of page views were using the default view, which listed items from all topics. The topics of “Technology Integration Ideas,” “Lesson Planning,” and “Ed Tech News” were the most popular topics visited, with 139, 107, and 106 page views respectively. The least popular topic selection was “Ed Tech Research” which was selected only 30 times.
An additional usage statistic of interest was the depth of navigation within the available content (Table 9). Because the content items listed on the site were divided into multiple pages that were limited to 15 items, the depth of navigation would indicate whether users were viewing items on the first page they visited or if they were navigating to subsequent pages for items of interest. As indicated in Table 9, 86% of the visits to content items were made when the item was listed on the first page of the content item list. An additional 5.5% of clicks were recorded on items that were displayed on the second page of content items. The number of user clicks to content items steadily decreases on subsequent pages.
Table 7. Total page views using filtering and sorting option
|
Type |
Option |
Count |
% |
Default view |
Recently Popular |
3082 |
75.6% |
Filter |
My Posted sites |
467 |
11.5% |
Sort |
Date (Newest first) |
231 |
5.7% |
Sort |
Highest Vote Count |
195 |
4.8% |
Filter |
Recently Viewed |
52 |
1.3% |
Sort |
Date (Oldest first) |
49 |
1.2% |
Table 8. Total Page views using topic
selection options
Topic Name |
Count |
Default View (no topic selected) |
2990 |
Technology Integration Ideas |
139 |
Lesson Planning |
107 |
Ed Tech News |
106 |
Teaching Strategies |
77 |
Curriculum Resources |
72 |
Software Tutorials |
37 |
Ed Tech Research |
30 |
|
Table 9. Number of content item visits recorded per page number
Page
Number |
Click count |
% of total |
1 |
3507 |
86.0% |
2 |
226 |
5.5% |
3 |
121 |
3.0% |
4 |
61 |
1.5% |
5 |
47 |
1.2% |
6 |
38 |
0.9% |
7 |
22 |
0.5% |
8 |
21 |
0.5% |
9 |
10 |
0.2% |
10 |
5 |
0.1% |
>10 |
20 |
0.5% |
Total |
4078 |
|
|
User Feedback Survey Summary
In addition to usage data, it was also important for this pilot study to incorporate user feedback on the system and the activity in general. As such, a survey of users was conducted following the completion of the activity. The primary goal of the user feedback survey was to provide additional context to the usage data as well as to discern the perceived value of this activity for the students. The user feedback survey was completed by 44 of the 74 users of the system.
In response to items regarding how users located content items for posting, the majority of users (84.1%) spent 30 minutes or less per week searching for content to post to the site, while the remaining 15.9% of respondent spent 30-60 minutes searching for content (Table 10). Further, the survey data revealed that users used multiple sources for locating content. Internet search engines were most commonly used, followed by Websites known prior to the course. While Internet search tools were the most frequently used, content was obtained from all of the sources included as options in the survey, including links from within the social content system itself.
In evaluating the perceived value of the activity, 93% indicated that this activity introduced them to web-based resources they would not have otherwise found. Further, 84% indicated that they found resources that would be useful in their future teaching career. In examining the average response to survey items concerning thevalue of the social content activity as indicated in Table 11, the responses were largely positive. Users believed that they were posting content that was relevant to the course objectives and also that the activity helped them learn about the use of technology in education.
Table 10. Sources used by users to locate new content items
|
|
Source |
N |
% |
Search Engine |
42 |
95.5% |
Websites known prior to course |
27 |
61.4% |
News sites (CNN, USA Today, etc) |
25 |
56.8% |
Websites introduced in other courses |
16 |
36.4% |
Websites introduced in THIS course |
14 |
31.8% |
Links from other posted items |
12 |
27.3% |
Discussion
This pilot study had two primary goals. The first was to better understand the usage patterns of the social content system in order to provide the foundation for future research and development. The second goal was to gain insight into the value of this activity with the context of an undergraduate course on educational technology.
Limitations of the study
One primary limitation of the study was caused by the technical difficulties encountered during the initial implementation of the social content system. Due to technical difficulties encountered by the website hosting company, the site was occasionally unavailable in the final weeks of the study period. It is unclear what effect the periodic outages may have had on the usage data and the perceptions of the value of the activity. It was for this reason that the activity was ultimately concluded prior to the time that was originally planned.
This study is also limited by the context in which it was implemented. The results of this study may have been influenced by the fact that it was conducted in an educational technology course and included primarily upper-level undergraduate students. The usage data and user perceptions may vary with different populations and course contexts.
Understanding user behavior
In seeking to better understand the usage data, several patterns emerged that can guide future development. The first pattern that emerged was that users were more likely to view content items that were listed on the first page. This pattern of shallow navigation within the site is also consistent with the user feedback data indicating that users spent 30 minutes or less per week using the system. While these data may seem disconcerting when evaluating the system as an instructional tool, it does not necessarily indicate a problem of the activity. Rather, it simply provides a decision for future development of the system. Based on the pilot study alone, it is difficult to understand whether the shallow navigation pattern exhibited by most users was an indication that the users were somewhat disengaged, or whether it was a success of the ranking algorithm that presented the most relevant content items on the first pages and also cycled content through to allow for newer items. The essential question is whether users did not WANT to navigate deeper into the site or whether they did not NEED to navigate deeper for valuable content. By comparing multiple variations of the system in future research, it will likely be possible to understand this usage pattern.
Table 11. User perceptions of the social content activity
(1=Strongly Disagree, 2 = Disagree, 3 = Neutral, 4 = Agree, 5 = Strongly Agree)
|
Mean |
Mode |
Std. Dev |
I enjoyed finding articles to post |
3.32 |
4 |
.96 |
The items that I posted were relevant to the course |
4.23 |
4 |
.52 |
I found the items posted by OTHER students to be relevant to the course |
4.05 |
4 |
.75 |
I found resources that I will use in the future |
4.00 |
4 |
.72 |
An activity like this would be useful in other courses I have taken or will be taking |
3.68 |
4 |
.96 |
I would use a website like this one even if it wasn’t
part of a course |
3.43 |
4 |
.95 |
This activity helped me learn about the use of
technology in education |
3.95 |
4 |
.78 |
This activity helped me find resources or information
that I may not otherwise have found. |
4.23 |
4 |
.74 |
Establishing baseline data
From this pilot study, it is possible to establish a baseline of usage data that can be used for comparison to future research. In the first implementation of the social content system, users were most likely to login on the day of class and also were most likely to meet the minimum requirements for the activity. On average, users visited 26 sites in the nine-week period and cast 19 votes. The average user would browse for content items on the first few pages presented and is more likely to cast a positive vote for each item visited. When users did filter and sort the content items, the “Technology Integration Ideas” topic was the most popular and users were more likely to sort for newer items rather than older items.
Determining success
When considering whether this activity was a success, the most relevant data is in the user feedback survey responses. A majority of respondents (88.6%) agreed with the statement that “This activity helped me learning about the use of technology in education.” Also, 83.7% of respondents agreed that they found resources that they would use in the future, while 93.2% indicated that they found resources or information that they may not have otherwise found. Though this is only part of the overall evaluation of this activity, the responses to these items do indicate that the activity was perceived as useful by the students and did meet the overall learning objectives. Though many questions about how this activity would compare to other types of strategies remains unclear, the results of this study do suggest that there is merit to the use of a social content system within an undergraduate educational technology course.
Recommendations for future research
It was the intention of this pilot study to establish a baseline for usage data and explore options for future research. It would be useful to connect activities such as this one to specific learning objectives and conduct comparative studies using multiple models of social content systems. Also, the inclusion of system usage data, user feedback, and also more detailed assessment of learning objectives will assist in determining which facets of this activity are most valuable as the evolution of these web-based tools continues to evolve.
In this case, the primary objective for this activity was to increase the awareness of various Internet-based resources for educators. While it is possible to say that users perceived an increase in the awareness of such resources, it is difficult to assert that this activity was more beneficial than others in accomplishing this goal. Further research will also be required to determine the influence on the design of the system itself on the awareness of these resources. For example, a rating system for content items that requires a more detail than can be provided by an “up or down” vote may increase the perceived value of the system. While this study suggests that technology systems focusing on social activities offer promise as instructional tools, exactly how these tools can be best implemented to enhance teaching and learning will require that research keep up with the rapidly changing technology environment.
References
Bull, G. (2005). Folk Taxonomies. Learning and Leading with Technology, 33(1), 22-23.
Lomas, C. (2005). 7 Things You Should Know About Social Bookmarking [Electronic Version]. EDUCAUSELearning Initiative from http://www.educause.edu/ir/library/pdf/ELI7001.pdf.
MacManus, R., & Porter, J. (2005). Web 2.0 for Designers [Electronic Version]. Digital Web magazine. Retrieved September 15, 2006 from http://www.digital-web.com/articles/web_2_for_designers.
O'Reilly, T. (2005). What is Web 2.0? Design Patterns and Business Models for the Next Generation of Software. Retrieved September 12, 2006, from http://www.oreillynet.com/pub/a/oreilly/tim/news/2005/09/30/what-is-web-20.html |